Integrating AI/ML into Continuous Delivery pipelines enables automated verification of production deployments, reducing manual effort by 85% and significantly improving deployment reliability and performance monitoring.
Interested in turning your deployment canary into a cybernetic living organism with AI/ML? Awesome, this blog is for you. I’m guessing you’re probably thinking two things right now:
- Why would you want to apply AI/ML to CD?
- How can you actually apply AI/ML to CD?
Let's walk through a typical deployment pipeline:
- Write code
- Commit code
- Build artifacts
- Test artifacts
- Deploy artifacts
- Verify artifacts
- Roll back artifacts
Right now, the majority of organizations are in the process of automating steps 1 through 5 using their CD process/platform. For most, CD stops at the deployment phase, which means the moment a new artifact hits production. We can argue over whether this should be called Continuous Delivery or Deployment later :)
However, what about understanding the actual business impact of these production deployments? Let's consider this specifically with regards to steps 6 and 7 above. What if we could use machine learning to automate these steps?
Understanding the Business Impact of Deployments
If DevOps and CD are about going from idea to "cha-ching" as quickly as possible, then shouldn’t we measure the cha-ching part? Believe it or not, deployment velocity is not a true barometer of success (despite the fact that it feels good). I was always amazed at how many conference attendees were claiming thousands of deployments/day yet very little had any sort of visibility into the impact of their changes/fixes/patches. How do you know if you’re deploying lots of good/bad ideas or changes to customers?
At Harness, we call steps 6 and 7 Continuous Verification, and we use unsupervised machine learning to automate these steps.
AI/ML 101
Before I dive into how Harness applies ML to CD, let's understand some ML basics. ML is a form of Artificial Intelligence (AI) that comes in two flavors:
- Supervised
- Unsupervised
Supervised typically requires humans to train the AI/ML algorithms and models by providing parameters, feedback or labels. For example, things like thresholds, ratings, rules, settings, and configuration are types of parameters/feedback that algorithms can use to get more accurate over time. You also might hear buzzwords like "neural feedback" that simply means soliciting feedback from humans.
Unsupervised is where AI/ML algorithms and their models can infer meaning and relationships from data on their own, without the need for human assistance or intervention. It's basically plug and play - you supply the data and the ML will figure out things by itself.
The tradeoff is that supervised is more accurate but generally requires extensive training & maintenance, whereas unsupervised is less accurate but is also pretty hands off. The benefits and value of supervised vs. unsupervised therefore vary significantly on the use case(s) and data sets being applied.
Applying AI and ML to Continuous Delivery
To verify the impact of any production deployment, we first need to understand (and measure) several KPIs relating to applications. Here are some example KPIs:
- Business - $ revenue, order volume, order throughput
- Performance & Availability - response time, throughput, stalls, uptime
- Resource - CPU, memory, I/O
- Quality - events, exceptions, and errors
Fortunately, nearly all of this data exists for a CD platform to leverage from tools like:
- Application performance monitoring (APM) - AppDynamics, New Relic, Dynatrace
- Infrastructure monitoring - Datadog, CloudWatch & Nagios
- Log monitoring - Splunk, ELK & Sumo Logic
- AIOps/ITOA - Moogsoft & BigPanda
- Synthetics - Selenium
Most applications these days also have their own health check page where some simple HTTP assertions can return you various KPIs.
At Harness, we’ve basically built connectors/webhooks that integrate with a lot of above toolsets to observe all application KPIs, data, and metrics following every production deployment. We then use unsupervised machine learning to automate the process of analyzing all the time-series metrics and event data from these sources. This analysis allows Harness to then automatically verify production deployments and identify any regressions, anomalies or failure which may have been introduced. It's pretty cool stuff.
So, what does all this fancy pants ML actually look like? Here's what a deployment pipeline looks like in Harness:

With Harness, you can verify production deployments with one or more verification sources regardless of whether the data is time-series metrics, unstructured events, or simple HTTP assertions. In the above example, both Splunk and AppDynamics are being used to verify the deployment.
Detecting Performance Regressions
Nothing sucks more than a slow app, so verifying performance post-deployment is a no-brainer. Build.com recently told us that 6-7 of their team leads would spend at least 60 minutes per deployment manually verifying their application performance using New Relic. With 3 production releases a week, that's almost 21 hours of manual effort to verify production deployments. Applying ML to this process reduced that effort to just 3 hours, which is an 85% reduction in workload.
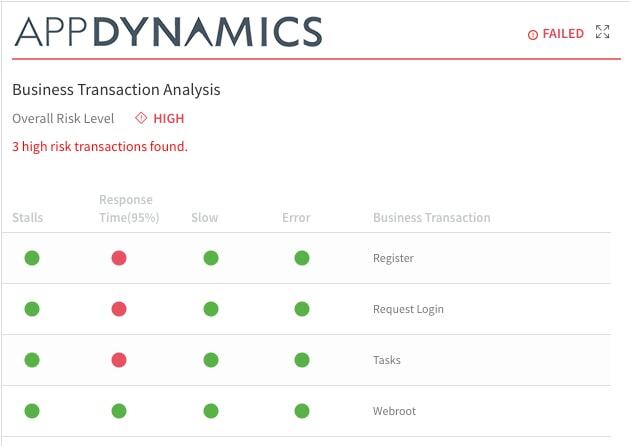
Below is a Harness screenshot showing the output of applying unsupervised machine learning (SAX & Markov) to an AppDynamics data set that's monitoring an application. You can see that the ML has identified 3 performance regressions relating to key business transactions:

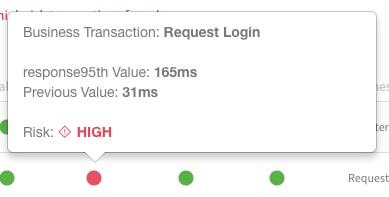
If we mouse-over any of these regressions, we can see why the ML algorithms have flagged these anomalies:

As you see, the response time for Request Login increased 5X from 31ms to 165ms. The great thing with ML is that algorithms execute in real-time, so the level of insight you get is almost instant. There is not gut feel with ML; everything is measurable and quantifiable. In this case, ML can quantify the exact business impact of every production deployment. At Harness, we've even had several eCommerce customers use $ revenue as a KPI to verify deployments and initiate rollbacks.
Detecting Quality Regressions
Performance without reliability is nothing. Keeping an eye on application events, exceptions, and errors post-deployment is critical. A major challenge these days is that most application consoles and logs are full of crap like ClassPath exceptions. What's worse is that most of these exceptions have existed for years, and are a major contributor to noise. You can actually apply machine learning to this problem to learn what events are benign and what events are new, unique, and anomalous to your apps and business.
Harness tokenizes event data from your log tools and applies several unsupervised machine ML algorithms like entropy, Kmeans clustering, Jacard, and Cosine to understand the relevance, uniqueness, and frequency of events that your applications generate post-deployment.
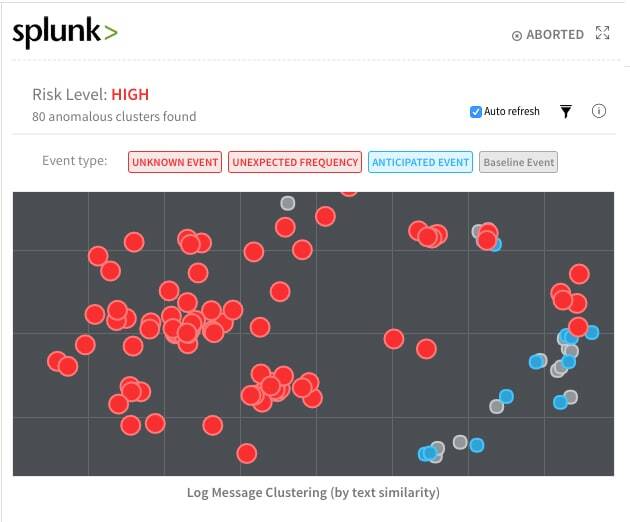
In the below example, Harness is using Splunk to continuously verify application quality by analyzing the log event data from the application. The Harness Kmeans algorithm builds "clusters" of related event data. Grey dots represent baseline events that Harness algorithms learn and infer as "normal" events that happen with every production deployment. Red dots represent unknown or new events that Harness has encountered for the first time, or they represent events with unusual frequency.

This example was actually taken from a customer production deployment where a developer accidentally used a semi-colon instead of a colon. As you can see, the deployment introduced tens of new exception regressions and caused Harness to perform an automatic rollback (Harness also allows manual rollback if you want more control).
Supervising the Unsupervised Machine Learning
One way to increase the accuracy of machine learning algorithms and models is to provide them with human feedback (supervision). Unsupervised ML isn't a silver bullet, the more humans participate with feedback loops the more smarter and accurate the results become.
It's entirely possible that Harness might flag certain application events/exceptions as anomalous that developers might perceive as normal/not interesting. In this scenario, you want to allow those developers to provide feedback.
In the above Splunk example, clicking on any red dot in the chart will show you the exact event/exception that caused the regression:

Notice the 'Ignore' and 'Dismiss' controls to the upper right of this event. These allow developers to either temporarily ignore events, or permanently dismiss them from future analysis by the ML algorithms. Over-time developers can train Harness so it only flags events/exceptions that really are unique, anomalous and relevant.
Smart Automated Rollback?
Using ML to assist and verify production deployments will soon become the new norm. What takes several humans 60 minutes to manually do can now be done in one or two minutes using machines. We can actually take this intelligence one step further, and start to do things with it, like automate rollbacks. This leads to a truly automated deployment pipeline that can deploy, verify and recover from any anomalies or failure it observes. Want to learn more about our AI/ML capabilities? Book your demo today.
Learn more: CI/CD Pipeline: Everything You Need to Know