
Harness Chaos Engineering (HCE) simplifies chaos engineering for enterprises by leveraging the open-source LitmusChaos project and offering a comprehensive, free plan with features like a cloud-native approach, extensive fault library, centralized control plane, and native integration with Harness pipelines. This enables structured experimentation, observability, and hypothesis validation to build resilient applications, supported by governance enforcement, detailed analytics, and guided chaos experiment execution.
Get Started With Harness Chaos Engineering Free Plan
Harness Chaos Engineering (HCE) is powered by the open source CNCF chaos engineering project, LitmusChaos. HCE adds additional features to make chaos engineering for enterprises easy. Harness offers a free hosted LitmusChaos, which includes features equivalent to LitmusChaos and also bundles Harness platform features such as RBAC and hosted logging—all for free.
Watch: Getting Started with Harness Chaos Engineering
---
Getting Started with Harness Chaos Engineering
Build resilient applications using the following steps:
1. Choose or build your application
2. Configure the chaos control plane:
- Set up an environment
- Set up chaos infrastructure
3. Create chaos experiments in your application
4. Execute the chaos experiments
5. Analyze the results
Chaos experiments need appropriate observability infrastructure to validate the hypotheses around the steady state. The practice of chaos engineering consists of performing experiments repeatedly by injecting various potential failures (chaos faults) to simulate real-world failure conditions against different resources (targets).
Harness Chaos Engineering simplifies chaos engineering practices for your organization. The diagram below describes the steps to induce chaos into an application.

---
Standard Chaos Experiment Flow of Control
The standard chaos experimentation flow involves the following steps:
1. Identify the steady state of the system or application under test and specify its service-level objectives (SLOs)
2. Hypothesize the impact a particular fault or failure would cause
3. Inject this failure (chaos fault) in a controlled manner (with a pre-determined and minimal blast radius)
4. Validate whether the hypothesis is proven, if the system meets the SLOs, and take appropriate actions if a weakness is found
---
Benefits of HCE
HCE goes beyond fault injection, helping you set up a fully operational chaos function based on the original principles of chaos and addressing several enterprise needs, including:
- Cloud-native approach: Supports declarative definition of experiments and Git-based chaos artifact sources (chaos-experiments-as-code).
- Extensive fault library: Offers a robust suite of ready-to-use experiments and supports complex custom experiments.
- Centralized control plane: Supports varied targets (Kubernetes-based microservices, cloud services, VMware infrastructure).
- Governance enforcement: Uses dedicated workspaces, chaos teams, and access control.
- Native integration: Works with Harness Continuous Delivery (CD) pipelines.
- Hypothesis validation: Uses probes and SLO management via integration with Harness Continuous Verification (CV).
- Guided GameDay execution: Provides detailed analytics and reporting based on experiment execution and application resilience.
- Chaos events, metrics, and logs: Aids in the instrumentation of APM dashboards with chaos context.
Harness Chaos Engineering Availability
- SaaS (Software-as-a-service): Sign up or get invited to a specific project. HCE helps manage the cluster.
- SMP (Self-managed platform): Create, manage, and maintain your clusters. You are responsible for providing permissions to projects and handling issues associated with them.
Prerequisites
Requirements and project-level permissions to execute chaos experiments:
1. Right permissions: Chaos Resources Role Permissions in Access Control
2. Permissions on the cloud account/Kubernetes cluster/VM: Kube RBAC, IAM Roles.
3. Enable necessary Feature Flags
4. Prepare target systems: VMs or K8s.
5. Prepare network connectivity, identify proxy requirements, firewall rules
6. Identify application/infrastructure steady-state parameters: Using APMs or logs.
7. Image registry requirements: Set up the registry with secrets.
8. Specific needs for Kubernetes: Namespace quotas, workload-specific labels, annotations, resource limits, proxy environments, and permissions for advanced use cases (SCC, IRSA, etc.).
9. ChaosHub requirements and connectivity to Git sources
Adding Users to a Project
To add a new user to a project:
1. In Harness, select a project
2. Expand the Project setup menu and select Access Control (This page lists all the users added to the current project)
3. Select New User and then
- In New User(s), add the email(s) of the user(s) you want to add.
- In User Groups, select any of the existing user groups to which you can add the user.
- Add the roles for the user(s) to enforce their access permissions.
4. Select the User Groups and roles to enforce access permissions.

5. Select Apply.
---
Requirements for Individual Chaos Faults
In the chaos faults reference, you'll find fault-specific requirements listed in the Use cases section of each fault, as shown, for example, in the use cases for the Kubelet service kill fault.
---
Chaos Infrastructure Requirements
The table below lists the chaos infrastructure execution plane components and the required resources. Install these components in your target cluster to allow the chaos infrastructure to run experiments.
.png)
---
Steps to Execute Chaos Experiments
Step 1: Create a project
- Create a new project or ask your administrator to add you to an existing project. Once you sign up or log in to your account, you can access the Chaos tab on the extreme left, which displays the recent experiments that were executed.

Step 2: Create an environment
- A chaos experiment is executed in a chaos infrastructure that is associated with an environment. To create a new environment, navigate to the Environments page, and choose a New Environment. Specify the environment name, a description (optional), and tags (optional). Select the environment type, Production or Non-Production. Finally, select Create to add the new environment.

TIP: You can also select one of the environments from the list of environments if it is available instead of creating an environment.
Step 3: Create an infrastructure
- Once you have created an environment, you can add chaos infrastructure to it. Depending on your application, you can select Kubernetes, Linux or Windows. In this tutorial, you can select a Kubernetes infrastructure, which you will use to inject faults into Kubernetes resources. You can use an existing infrastructure or create a new one. In this tutorial, you can create a new infrastructure. For this, select Enable chaos.

4. This will lead you to a page where you can select an existing infrastructure or create a new infrastructure. Select On New Infrastructures and select Continue.

5. Provide a name, a description (optional), and tags (optional) for your chaos infrastructure. Click Next.

6. In this step, choose the installation type as Kubernetes, access type as Specific namespace access (click Change to display the Specific namespace access access type), namespace as hce, and service account name as hce. Select Next.

TIP: The Cluster-wide access installation mode allows you to target resources across all the namespaces in your cluster whereas the Specific namespace access mode restricts chaos injection to only the namespace in which the delegate is installed.
- Ensure you have access to your Kubernetes cluster via kubectl. Select Download to deploy your chaos infrastructure by downloading and applying the given manifest using your terminal. Once done, choose Done.

8. It may take some time for the delegate to be set up in the Kubernetes cluster. Navigate to Environments and once the delegate is ready, the connection status displays as CONNECTED.

Step 4: Create a demo application and observability infrastructure
Once you are all ready to target our Kubernetes resources, you can execute the simplest fault, Pod Delete. The "pod delete" chaos fault deletes the pods of a deployment, StatefulSet, DaemonSet, etc, to validate the resiliency of a microservice application.
- You can use your application as a target, however, in this tutorial, use the Online Boutique microservices demo application as the target.
- Before you set up the chaos experiment, install the target application. Run the following commands to set the target application microservices and observability infrastructure (optional), including Grafana, Prometheus, and a BlackBox exporter. Installing the observability infrastructure (optional) provides a dashboard that helps validate the health of the constituent application microservices in real-time.
❯ kubectl apply -f https://raw.githubusercontent.com/chaosnative/harness-chaos-demo/main/boutique-app-manifests/manifest/app.yaml -n hce
❯ kubectl apply -f https://raw.githubusercontent.com/chaosnative/harness-chaos-demo/main/boutique-app-manifests/manifest/monitoring.yaml -n hce
- Earlier, you specified the installation mode as Specific namespace access, hence the resources are deployed in the hce namespace.
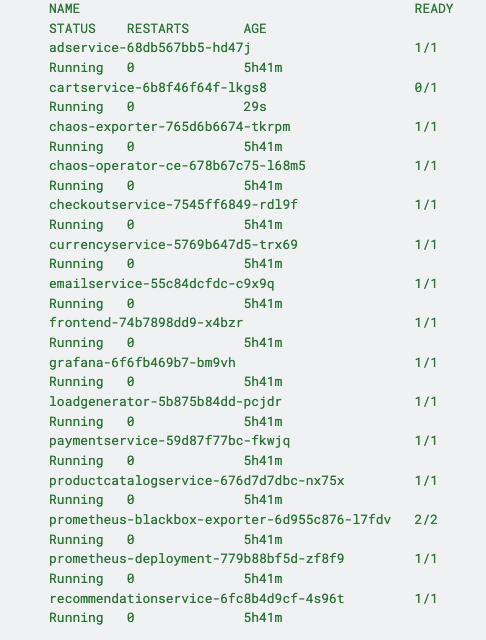
- The target application and observability infrastructure pods are available in the hce namespace
- To view the pods in the hce namespace, execute the command below:
❯ kubectl get pods -n hce


12. To list the services available in the hce namespace, execute the command below
❯ kubectl get services -n hce


13. To access the frontend of the target application in your browser, use the frontend-external LoadBalancer service.

14. Similarly, you can access the Grafana dashboard. Login with the default credentials, that is, username admin and password admin, and browse the Online Boutique application dashboard. Currently, all the metrics indicate normal application behavior.

Step 5: Construct a chaos experimentSince the target application has been deployed, you can now create a chaos experiment. You will target the pods of the carts microservice with the pod delete fault. Currently, the cart page is healthy and accessible from the front end, as seen in the /cart route.

- To create a chaos experiment, go to Chaos Experiments page and select New Experiment.

16. Specify the experiment name and a description (optional) and tags (optional). Choose the target infrastructure that you created earlier, click Apply, and click Next.

17. In the Experiment Builder, choose Templates from Chaos Hubs and select Boutique cart delete. This allows you to create a chaos experiment using a pre-defined template that already has a pod delete chaos fault configured to target the online boutique application. Select Use this template to continue.

18. Your target is the carts microservice. Hence the appropriate hce application namespace and the app=cartservice application label have been provided here. Also, the application kind is deployment. You can discover these entities from within the UI using the search dropdown menu for the respective inputs.

19. Choose the Tune Fault tab to view the fault parameters. Here, you can tune the fault parameters. Set Total Chaos Duration to 30, Chaos Interval to 10, and Force to false. You can leave the Pods affected perc empty for now. The values for Total Chaos Duration and Chaos Interval indicate that for every value of 10 seconds, the cart microservice pod(s) are deleted for a total of 30 seconds. By default, at least one pod of the cart deployment is targeted.

20. Navigate to the Probes tab. Here, you can either create a probe or select a pre-defined probe. Click Select or Add new probes. In this tutorial, you can select a pre-defined probe and add it to your chaos fault.

21. To add a pre-defined probe to your chaos experiment, click the filter button and search for http-cartservice. This cartservice validates the availability of the /cart URL endpoint when you execute the pod delete fault.


22. Click Add to Fault.

NOTE: Under probe details, you can see that the URL is http://frontend/cart and the response timeout is 15 ms. As a part of the probe execution, GET requests are made to the specified URL. If no HTTP response is found within 15 ms, the probe status is considered as 'failed'. If all the probe executions pass, then the probe status is considered as 'passed'. You can find other probe details in the properties field.
- Select mode as Continuous. Click Apply changes.

24. This will close the probes tab, and now, you can click Apply changes to apply the configuration to the chaos experiment.

Step 6: Observing chaos execution
- To execute the chaos experiment, click Save, and then Run.

26. You can see that once you click Run, an experiment run is scheduled. You can see the status of every step in the tab.

27. Select Recent experiment runs to view the runs of an experiment. The latest experiment is displayed in the last bar with the status as RUNNING.

28. To check the status of the cart deployment pod, execute the command below. The pod delete fault terminates the cart pod and replaces it with a new pod, for which a container is yet to be created.
❯ kubectl get pods -n hce

29. As a consequence, if you try to access the frontend cart page, you will encounter the following error which indicates that the application is now unreachable.

30. You can validate this behavior using the application metrics dashboard too. The probe success percentage for website availability (200 response code) decreases steeply along with the 99th percentile (green line) queries per second (QPS) and access duration for the application microservices. Also, the mean QPS (yellow line) steeply increases. This is because no pod is available at the moment to service the query requests.

Step 7: Evaluate the experiment run
- When the experiment execution concludes, you get a resilience score of 0 %. You will observe that the pod delete fault step failed. Before analyzing the experiment result, you can validate that the application is now again accessible, without any errors. You can validate this from the Grafana dashboard metrics that indicate the app returning to normal as the chaos duration is over.

- You can check the chaos result that shows the pod delete as Failed. This is because the 'http-cart-service' probe failed. The failure is due to the unavailability of the cart pod and therefore the /cart endpoint, due to injecting the "pod delete" fault.

NOTE: You can see that the value expected and the value obtained don't match. Hence, the probe fails.

Congratulations on running your first chaos experiment! Want to know how to remediate the application so as to pass the experiment run and probe checks? Increase the experiment pods to at least two so that at least one deployment pod survives the pod delete fault and helps the application stay afloat. Try running it on your own!
For users and fans of LitmusChaos, this is an opportunity to enhance and upgrade your Chaos Engineering journey by migrating to LitmusChaos Cloud. Sign up for FREE to experience the ease of resilience verification using chaos experiments. The free plan allows you to run a few chaos experiments at no charge for an unlimited time, boosting Chaos Engineering for the community.
Harness' Chaos Engineering ROI Calculator helps estimate business losses from outages and evaluates the ROI of chaos engineering practices. By simulating failures and optimizing recovery, it improves system reliability and reduces downtime, providing a clear financial benefit to organizations.

All this author’s posts
Prithvi Raj loves solving problems at the intersection of business and technology.