
Harness successfully reduced the memory footprint of its CD Community Edition from 12 GB to 3 GB, enabling it to run on personal laptops with 3 GB of memory and 2 CPUs, supporting up to eight concurrent deployments. This optimization was achieved through detailed memory profiling, heap usage reduction, thread count optimization, and switching GC algorithms.
Recently, Harness launched its CD Community Edition. It’s a forever free, source-available, on-premises edition of Harness CD. Join us on the journey of how we managed to ship Harness CD Community Edition with the resource requirements of 3 GB of memory and 2 CPUs.
When we started working on Harness CD Community Edition, a key goal was to ship it with sufficiently low resource specs so that developers can download, install, and use the product even on their personal laptops. We wanted anyone with 3 GB of memory and 2 CPUs to be able to use the product without any issues.
Today, in Part 1 of this post, we’ll discuss how we have run all of our services within the 3 GB memory limit. In Part 2, we’ll discuss how we achieved our other targets of 2 CPUs and keeping the overall product startup time to approximately two minutes for the best developer experience.
As of the publishing date for this post, we can run up to eight concurrent deployments with these specs on a laptop without any issues!
Background
In Harness, we have a microservices-based architecture. Harness CD Community Edition is shipped with 12 services in total:
- Two UI services
- Infrastructure services (Mongo, Redis, NGINX)
- Manager services for handling Secrets, Connectors, Git Experience, Authentication [Java]
- Pipeline service [Java]
- Delegate Proxy service
- Source Code Management Service (SCM) [Go]
- Log service [Go]
- Notification service [Java]
When we started this effort, the overall memory footprint for these 12 services was approximately 12 GB. The following image has the output of the “docker stats” command.
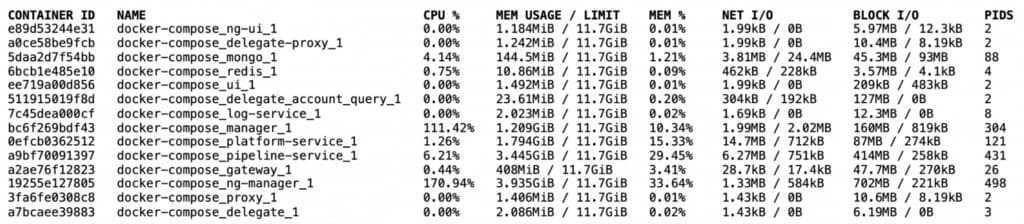
Here, we see that four of our main Java based services used roughly 11 GB of memory out of the total 12 GB of memory. The eight other services consumed far less memory comparatively.
For these eight services, we estimated that roughly 300 MB of memory was required for Mongo and 128 MB was required for Redis to cater to the expected workload, and the six other services could fit roughly within 300 MB of memory. That left us with approximately 2.25 GB (3 - 0.75 GB) of memory for our four other main services.
This meant that we had to diminish the memory requirements of each of these four services from the current 2.75 GB of memory on average per service to 600 MB of memory to achieve our target. The following sections detail how we did this.
Memory Profiling
Before we could reduce the memory, we first had to understand how these services are using their memory.
Note that since all four of the services are Java-based services, we will take NG Manager service as an example here. A similar process was followed for the three other services.
Java provides a simple way to visualize JVM memory usage. We can enable Native Memory Tracking (NMT), which tracks the internal memory usage of the JVM. NMT can be enabled by using this command line option: -XX:NativeMemoryTracking=summary
Once memory tracking is enabled, we can get the current JVM memory usage using this command: jcmd <Java_Process_ID> VM.native_memory summary
Here’s the memory profile of NG Manager service when we started:
Memory AreaDescriptionUsageHeapHolds Java Objects. Biggest chunk of memory768 MBClass MetadataContains information about the classes that JVM has loaded180 MBThreadsThread Stack (1 MB per thread)600 MBCodeCompiled code by JIT compiler is placed here50 MBGCMemory used by GC algorithm for its processing80 MBInternalUsed for JVM Internal operations. Direct Byte Buffers are allocated here200 MBSymbolConstants from class files50 MB
On analyzing this profile, we gained valuable insights regarding where to focus our efforts to reduce the memory footprint.
- Heap: It used approximately 40% of the total memory.
- Threads: 600 threads are too high for a service. Rather, the service is in the idle state and serving no load.
Optimizing these two areas could provide gains of up to 1 GB. Therefore, we started by focusing on them first.
Reducing Heap Usage
To reduce heap memory, we started analyzing heap usage. For heap analysis, heap dumps are required. You can easily generate a heap dump from the AWS Command Line Interface (CLI) by using this command:
jmap -dump:format=b,file=heapdump.hprof <Java_Process_ID>
Tools such as JProfiler, YourKit, and JVisualVM can be used to open heap dump files and perform the analysis.
When we analyzed the heap dump of NG Manager service, we gained the following insights:
- The service is using approximately 128 MB of heap in the idle state (when there is no workload).
- On running deployments, heap usage goes up to 180 MB.
- There are no dominator objects.
This indicated that we’re over-allocating heap memory to the service. It needs roughly 180 MB of memory, but we have specified it to be 768 MB.
At the end, we decided to allocate a maximum of 256 MB of heap memory (2x of idle usage) to the service.
Reducing Threads
Thread dump is the standard way in Java to get a snapshot of every thread running inside of the process. Thread Dump also captures the following:
- Stack trace associated with each thread.
- State of each thread (Runnable/Blocked/Waiting).
Thread dump can be taken from the AWS CLI by using this command:
jstack <Java_Process_ID>
Analyzing the service’s thread dump revealed the root cause of the large number of threads.
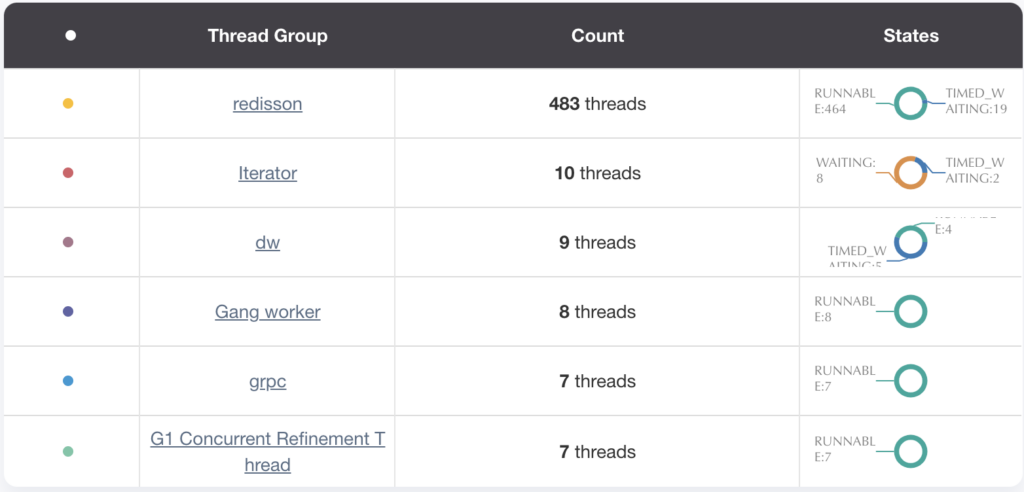
- We use Redis Streams for event-driven communication among our microservices. Each Redis producer and consumer in the service had its own Redisson client, and each Redisson client had 16 threads configured (see the following image).
- A few of the executor services were unbounded.
- There were a high number of threads configured to run cron jobs in parallel.
To fix these issues, we did the following:
- Reused Redisson clients among producers and consumers. Redisson clients are thread safe, so reusing a Redisson client isn’t an issue.
- Bound executor services.
- Reduced parallelism while running cron jobs by reducing the number of threads.
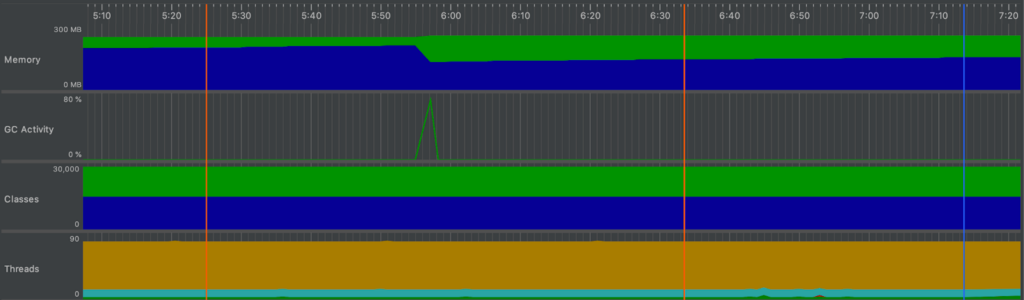
After making these changes, we brought down the number of threads for the service to approximately 100.
As you can see, we reduced the memory by around 1 GB after optimizing heap size and reducing the thread count.
As a side effect of these changes, JVM internal memory usage also came down from 200 MB to 80 MB. To bring down the memory usage even further, we shifted our focus on GC and Code memory usage. Furthermore, we couldn’t optimize Class Metadata usage primarily because it contains information about the classes loaded by the JVM, and JVM loads a class only when the application needs it.
Reducing GC and Code Usage
To reduce the GC memory usage, we switched the GC algorithm from G1GC to Serial GC. The main reasons for this choice were:
- Choosing a parallel GC algorithm, such as G1GC, which can utilize multiple cores, didn’t make sense in our case. We had very few CPU cycles (two CPUs for running all 12 services) at our disposal.
- The heap size was small – just 256 MB. Therefore, we could afford to sacrifice the G1GC ability to collect the garbage from the heap by dividing it into regions and processing them in parallel.
We also disabled the Tiered Compilation (-XX:-TieredCompilation), since we were severely constrained by the memory. In our performance tests, we didn’t notice any performance degradation in the application as a side-effect. Therefore, we persisted with this choice.
Final Results
After making all of these changes, we could bring down the memory usage of NG Manager service to about 600 MB.
Memory AreaUsageHeap256 MBClass Metadata160 MBThreads90 MBCode7 MBGC1 MBInternal40 MBSymbol40 MB
After doing similar analysis and changes for the other three services, we could also significantly bring down their memory usage.
ServiceMemory UsagePipeline 660 MBCG Manager780 MBNG Manager752 MBPlatform244 MB
Conclusion
We hope that you enjoyed this journey with us. But we won’t stop here. We have already begun efforts to reduce the memory requirements even further to provide the best experience for developers.
Don’t wait to try out Harness CD Community Edition. Harness CD Community Edition can be found on GitHub.
Stay tuned for Part 2 on optimizing CPU usage and product startup time!

All this author’s posts
1. Computer Science Graduate with 7+ years of experience in enterprise software product's design and development. 2. Currently working on Informatica's Intelligent Big Data Product. 3. Strong CS fundamentals in [Distributed Data Intensive Systems, Databases (SQL + NoSQL), Data Structures & Algorithms, Operating Systems, Computer Networking, Concurrency, Object-Oriented Programming, Performance, Scalability]