Harness Blog
Featured Blogs

Today, Harness is announcing the General Availability of Artifact Registry, a milestone that marks more than a new product release. It represents a deliberate shift in how artifact management should work in secure software delivery.
For years, teams have accepted a strange reality: you build in one system, deploy in another, and manage artifacts somewhere else entirely. CI/CD pipelines run in one place, artifacts live in a third-party registry, and security scans happen downstream. When developers need to publish, pull, or debug an artifact, they leave their pipelines, log into another tool, and return to finish their work.
It works, but it’s fragmented, expensive, and increasingly difficult to govern and secure.
At Harness, we believe artifact management belongs inside the platform where software is built and delivered. That belief led to Harness Artifact Registry.
A Startup Inside Harness
Artifact Registry started as a small, high-ownership bet inside Harness and a dedicated team with a clear thesis: artifact management shouldn’t be a separate system developers have to leave their pipelines to use. We treated it like a seed startup inside the company, moving fast with direct customer feedback and a single-threaded leader driving the vision.The message from enterprise teams was consistent: they didn’t want to stitch together separate tools for artifact storage, open source dependency security, and vulnerability scanning.
So we built it that way.
In just over a year, Artifact Registry moved from concept to core product. What started with a single design partner expanded to double digit enterprise customers pre-GA – the kind of pull-through adoption that signals we've identified a critical gap in the DevOps toolchain.
Today, Artifact Registry supports a broad range of container formats, package ecosystems, and AI artifacts, including Docker, Helm (OCI), Python, npm, Go, NuGet, Dart, Conda, and more, with additional support on the way. Enterprise teams are standardizing on it across CI pipelines, reducing registry sprawl, and eliminating the friction of managing diverse artifacts outside their delivery workflows.
One early enterprise customer, Drax Group, consolidated multiple container and package types into Harness Artifact Registry and achieved 100 percent adoption across teams after standardizing on the platform.
As their Head of Software Engineering put it:
"Harness is helping us achieve a single source of truth for all artifact types containerized and non-containerized alike making sure every piece of software is verified before it reaches production." - Jasper van Rijn
Why This Matters: The Registry as a Control Point
In modern DevSecOps environments, artifacts sit at the center of delivery. Builds generate them, deployments promote them, rollbacks depend on them, and governance decisions attach to them. Yet registries have traditionally operated as external storage systems, disconnected from CI/CD orchestration and policy enforcement.
That separation no longer holds up against today’s threat landscape.
Software supply chain attacks are more frequent and more sophisticated. The SolarWinds breach showed how malicious code embedded in trusted update binaries can infiltrate thousands of organizations. More recently, the Shai-Hulud 2.0 campaign compromised hundreds of npm packages and spread automatically across tens of thousands of downstream repositories.
These incidents reveal an important business reality: risk often enters early in the software lifecycle, embedded in third-party components and artifacts long before a product reaches customers.When artifact storage, open source governance, and security scanning are managed in separate systems, oversight becomes fragmented. Controls are applied after the fact, visibility is incomplete, and teams operate in silos. The result is slower response times, higher operational costs, and increased exposure.
We saw an opportunity to simplify and strengthen this model.

By embedding artifact management directly into the Harness platform, the registry becomes a built-in control point within the delivery lifecycle. RBAC, audit logging, replication, quotas, scanning, and policy enforcement operate inside the same platform where pipelines run. Instead of stitching together siloed systems, teams manage artifacts alongside builds, deployments, and security workflows. The outcome is streamlined operations, clearer accountability, and proactive risk management applied at the earliest possible stage rather than after issues surface.
Introducing Dependency Firewall: Blocking Risk at Ingest
Security is one of the clearest examples of why registry-native governance matters.
Artifact Registry delivers this through Dependency Firewall, a registry-level enforcement control applied at dependency ingest. Rather than relying on downstream CI scans after a package has already entered a build, Dependency Firewall evaluates dependency requests in real time as artifacts enter the registry. Policies can automatically block components with known CVEs, license violations, excessive severity thresholds, or untrusted upstream sources before they are cached or consumed by pipelines.
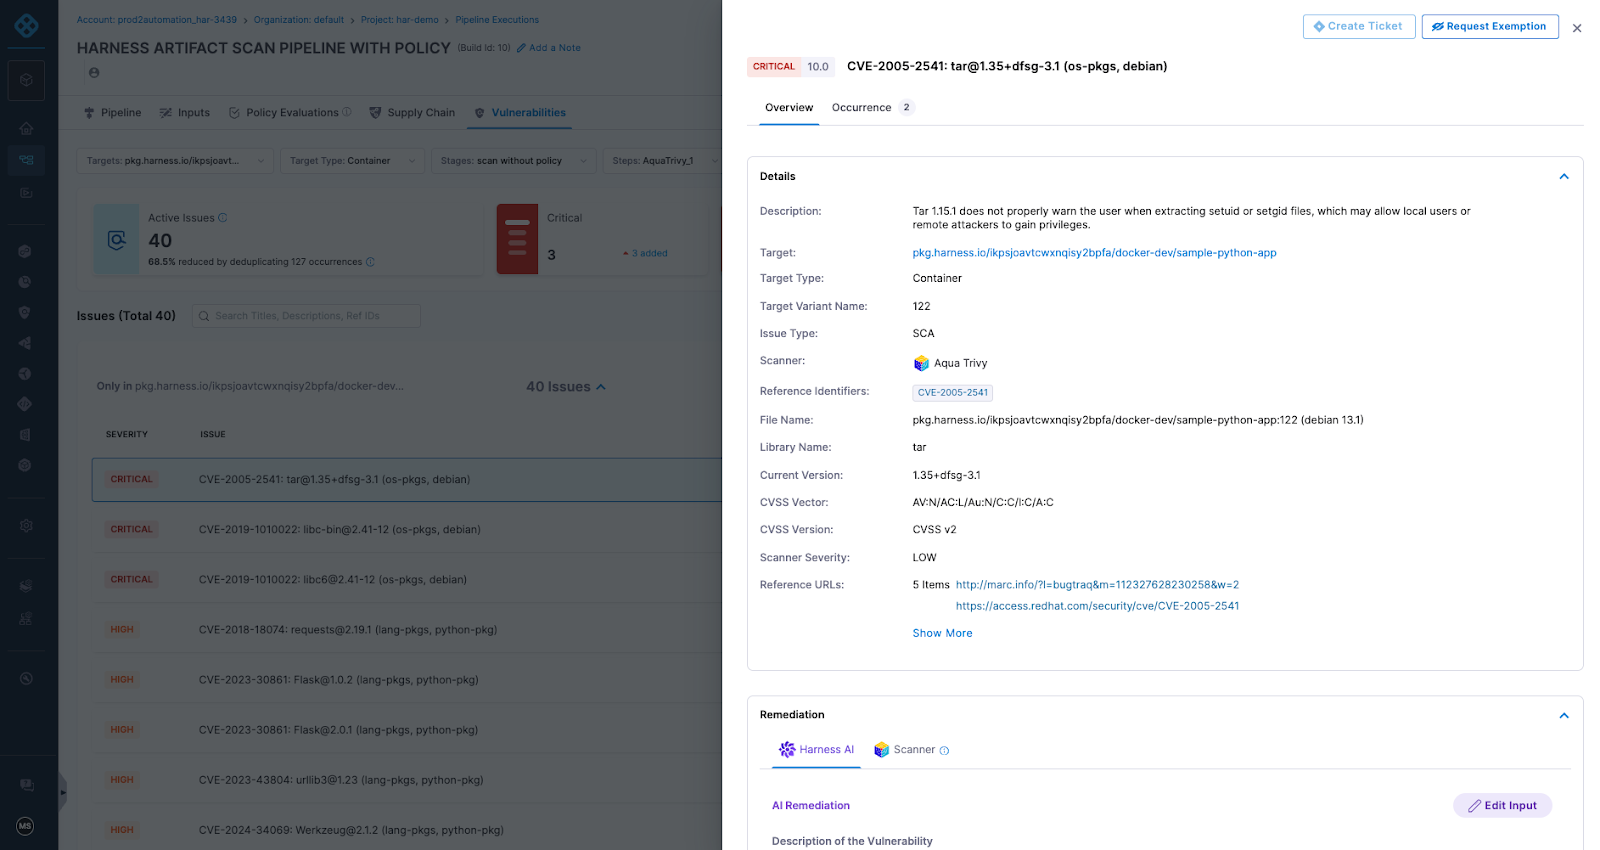
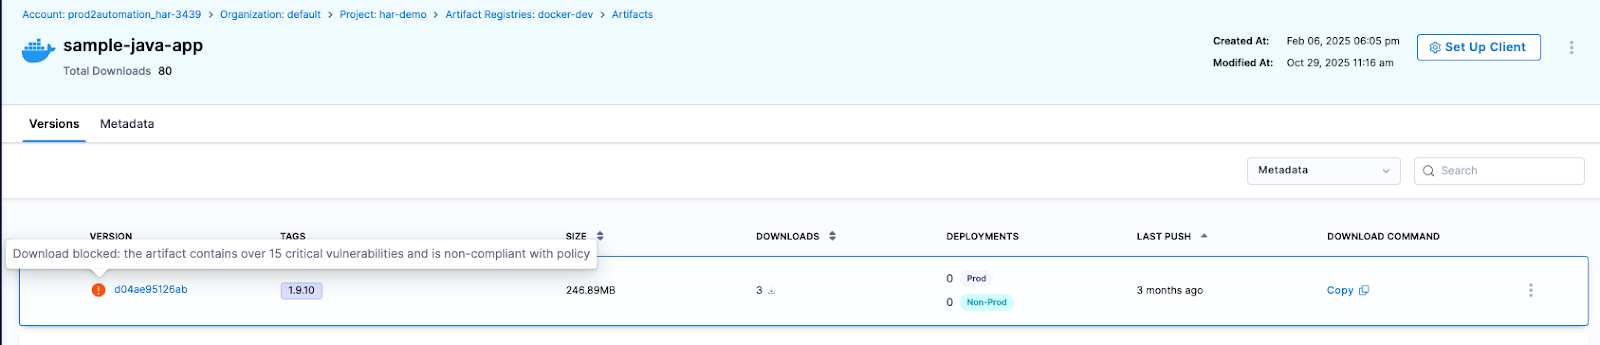
Artifact quarantine extends this model by automatically isolating artifacts that fail vulnerability or compliance checks. If an artifact does not meet defined policy requirements, it cannot be downloaded, promoted, or deployed until the issue is addressed. All quarantine and release actions are governed by role-based access controls and fully auditable, ensuring transparency and accountability. Built-in scanning powered by Aqua Trivy, combined with integrations across more than 40 security tools in Harness, feeds results directly into policy evaluation. This allows organizations to automate release or quarantine decisions in real time, reducing manual intervention while strengthening control at the artifact boundary.
The result is a registry that functions as an active supply chain control point, enforcing governance at the artifact boundary and reducing risk before it propagates downstream.
The Future of Artifact Management is here
General Availability signals that Artifact Registry is now a core pillar of the Harness platform. Over the past year, we’ve hardened performance, expanded artifact format support, scaled multi-region replication, and refined enterprise-grade controls. Customers are running high-throughput CI pipelines against it in production environments, and internal Harness teams rely on it daily.
We’re continuing to invest in:
- Expanded package ecosystem support
- Advanced lifecycle management, immutability, and auditing
- Deeper integration with Harness Security and the Internal Developer Portal
- AI-powered agents for OSS governance, lifecycle automation, and artifact intelligence
Modern software delivery demands clear control over how software is built, secured, and distributed. As supply chain threats increase and delivery velocity accelerates, organizations need earlier visibility and enforcement without introducing new friction or operational complexity.
We invite you to sign up for a demo and see firsthand how Harness Artifact Registry delivers high-performance artifact distribution with built-in security and governance at scale.

TLDR: We have rolled out Project Movement: the ability to transfer entire Harness projects between Organizations with a few clicks. It's been our most-requested Platform feature for a reason. Your pipelines, configurations, and rest come along for the ride.
What are Projects and Organizations?
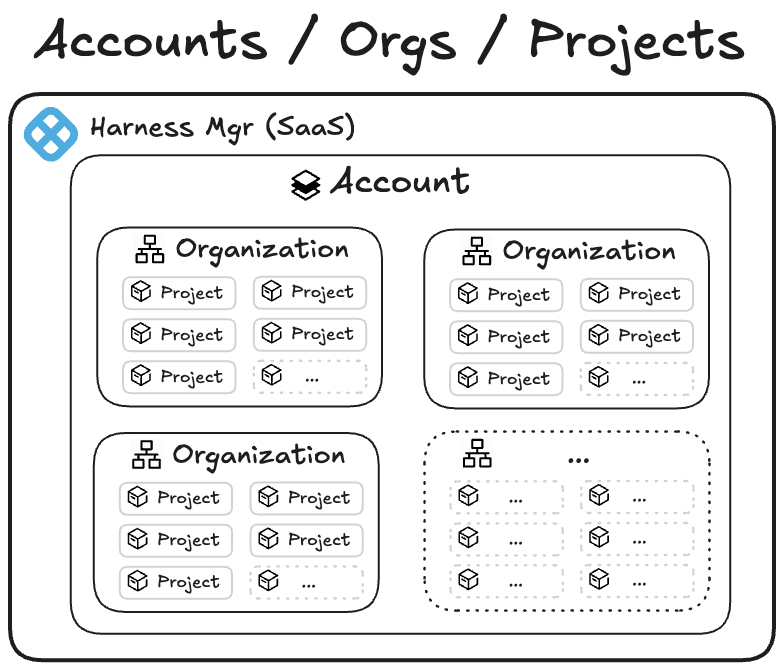
In Harness, an Account is the highest-scoped entity. It contains organizations and projects. An organization is the space that represents your business unit or team and helps you manage users, access, and shared settings in one place. Within an organization, a project is where your teams do their day-to-day work, such as building pipelines, managing services, and tracking deployments. Projects keep related resources grouped together, making it easier to collaborate, control permissions, and scale across teams.
The main benefit of keeping organizations and projects separate is strong isolation and predictability. By not allowing projects to move between organizations, you can ensure that each organization serves as a rigid boundary for security, RBAC, governance, billing, and integrations. Customers could trust that once a project was created within an org, all its permissions, secrets, connectors, audit history, and compliance settings would remain stable and wouldn’t be accidentally inherited or lost during a move. This reduced the risk of misconfiguration, privilege escalation, broken pipelines, or compliance violations — especially for large enterprises with multiple business units or regulated environments.
However, imagine this scenario: last quarter, your company reorganized around customer segments. This quarter, two teams merged. Next quarter, who knows—but your software delivery shouldn't grind to a halt every time someone redraws the org chart.
We've heard this story from dozens of customers: the experimental project that became critical, the team consolidation that changed ownership, the restructure that reshuffled which team owns what. And until now, moving a Harness project from one Organization to another meant one thing: start from scratch.
Not anymore.
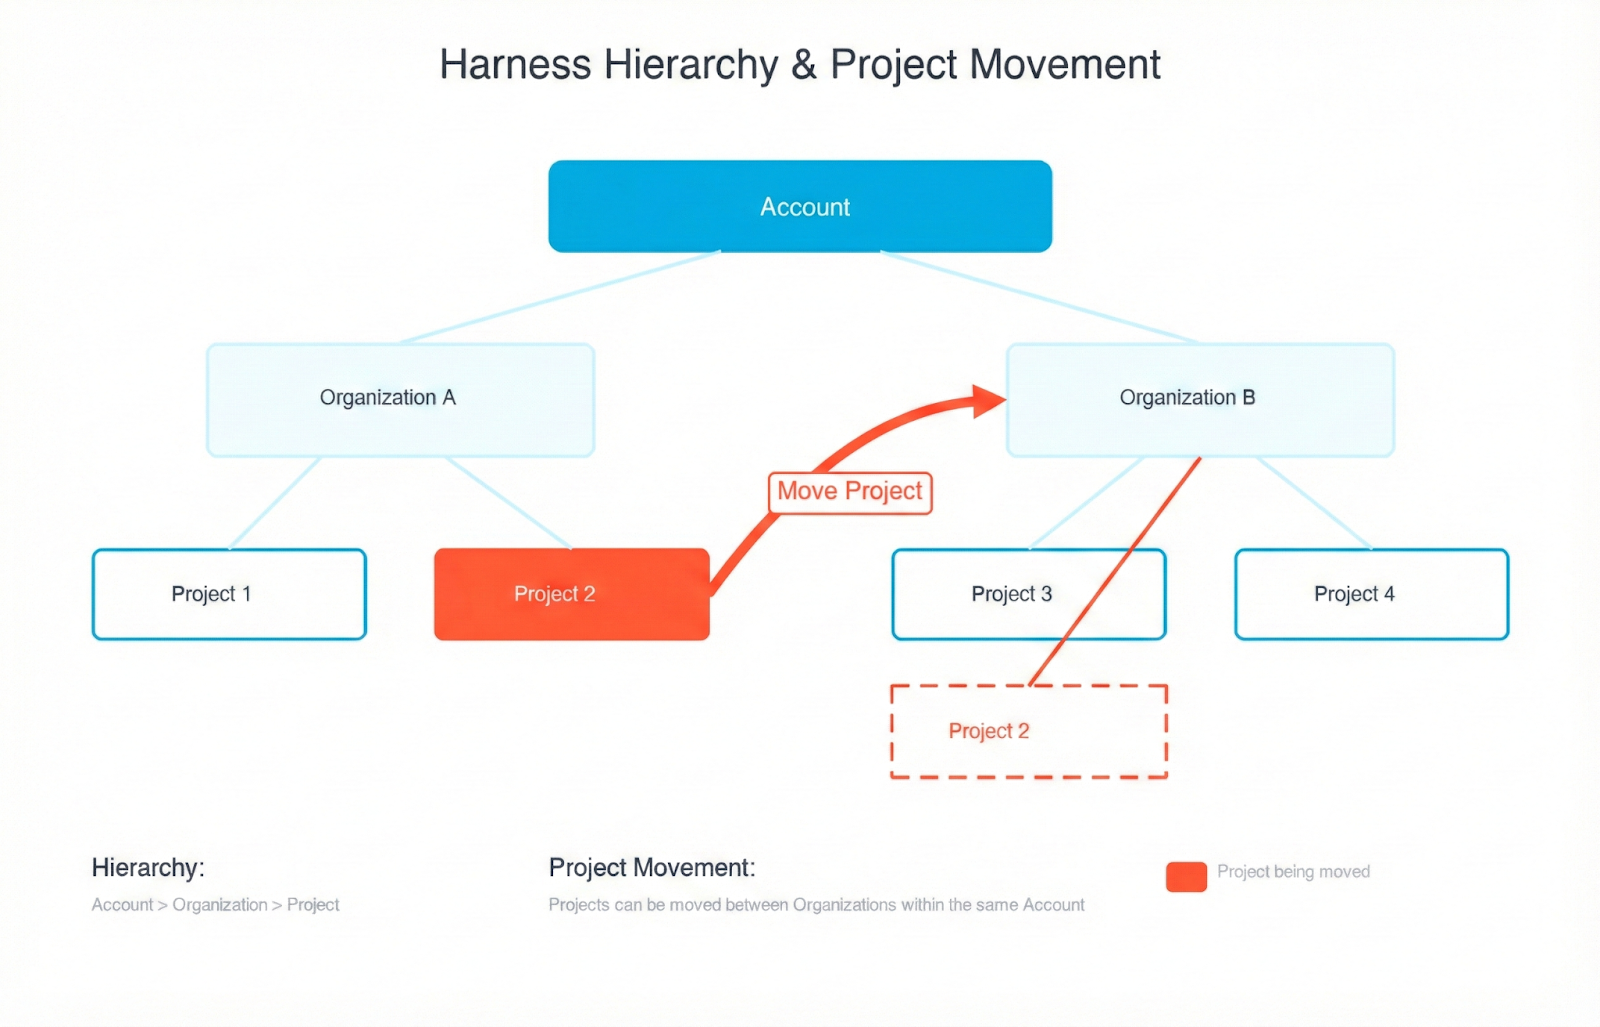
That’s why we have rolled out Project Movement—the ability to transfer entire Harness projects between Organizations with a few clicks. It's been our most-requested Platform feature for a reason. Your pipelines, configurations, and rest come along for the ride.
What Moving a Project Actually Feels Like
You're looking at 47 pipelines, 200+ deployment executions, a dozen services, and countless hours of configuration work. The company's org chart says this project now belongs to a different team. Deep breath.
Click the menu. Select "Move Project." Pick your destination Organization.
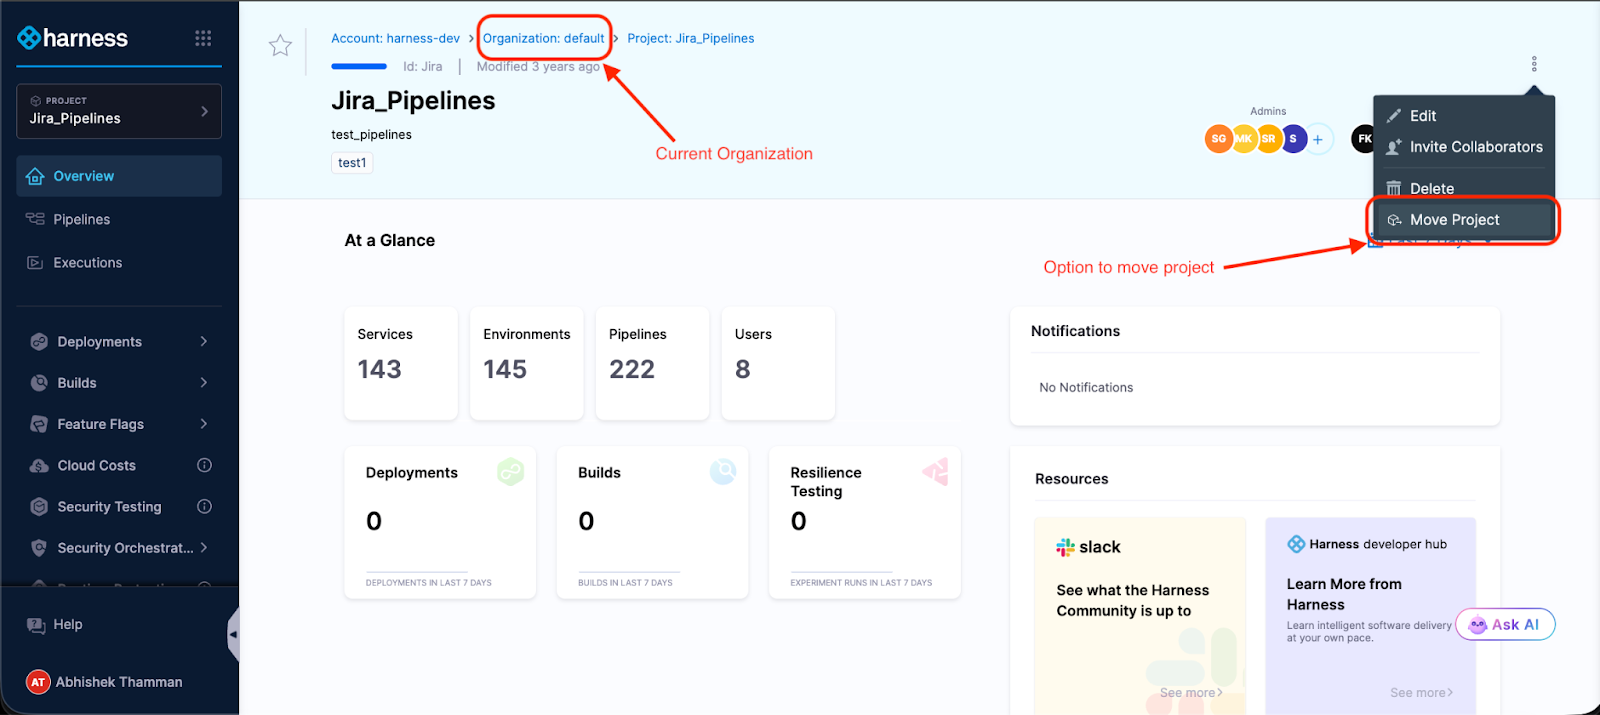
The modal shows you what might break—Organization-level connectors, secrets, and templates that the project references. Not an exhaustive list, but enough to know what you're getting into.

Type the project identifier to confirm.
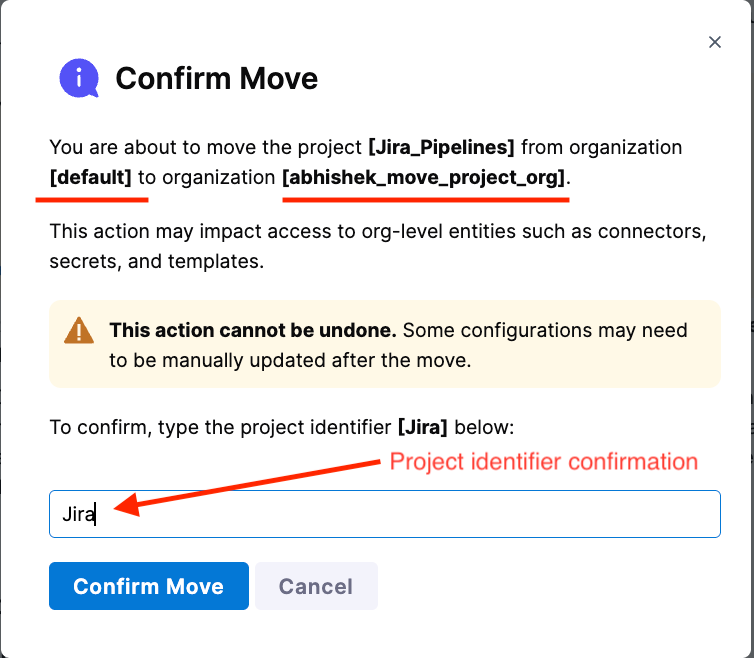
Done.
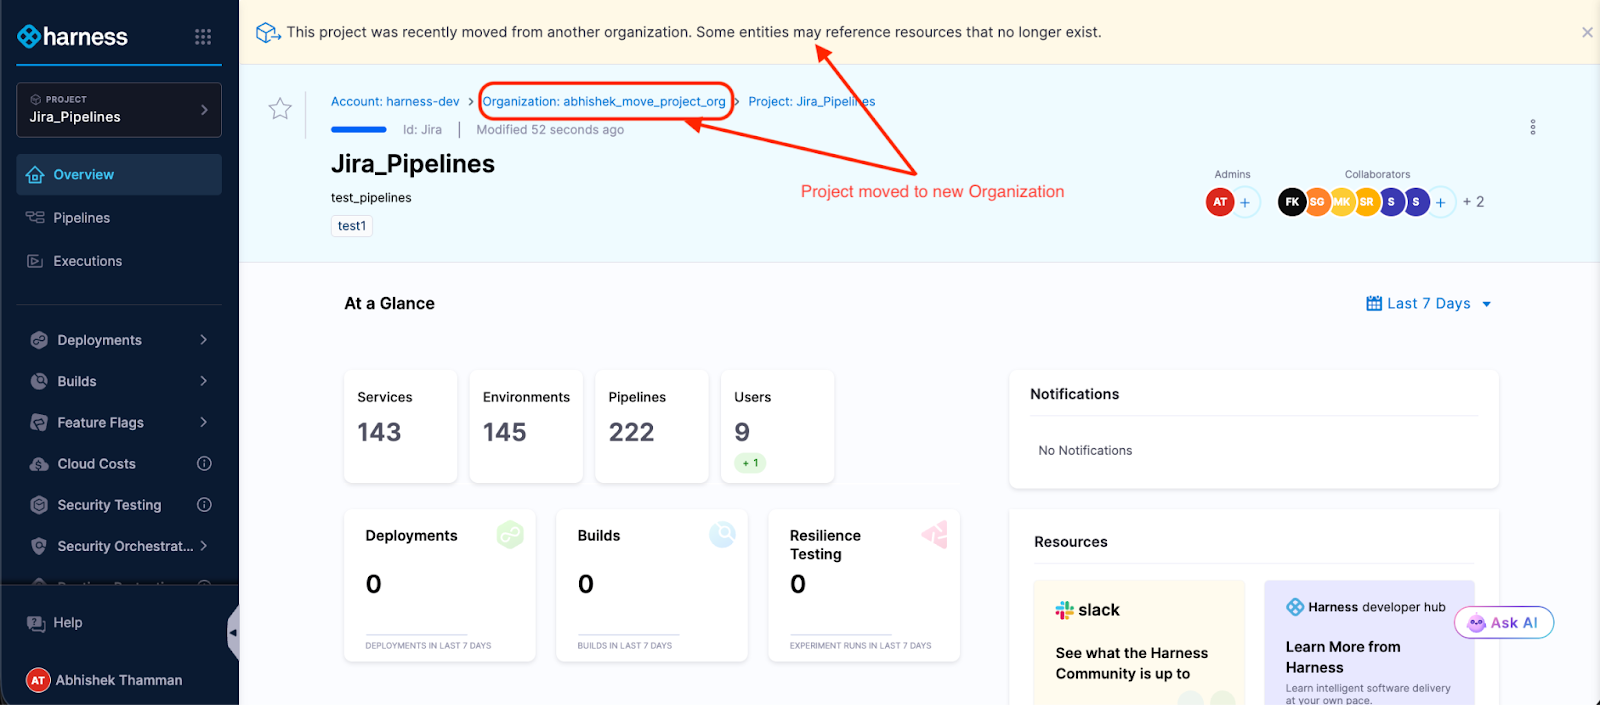
Your project is now in its new Organization. Pipelines intact. Execution history preserved. Templates, secrets, connectors—all right where you left them. The access control migration happens in the background while you grab coffee.
What used to take days of YAML wrangling and "did we remember to migrate X?" conversations now takes minutes.
To summarize:
To move a Harness project between organizations:
1. Open the project menu and select “Move Project.”
2. Choose the destination organization.
3. Review impacted organization-level resources.
4. Confirm by typing the project identifier.
5. Monitor access control migration while pipelines remain intact.
What Moves with Projects
Here's what transfers automatically when you move a project:
- Platform - Your pipelines with their full execution history, all triggers and input sets, services and environments, project-scoped connectors, secrets, templates, delegates, and webhooks.
- Continuous Delivery (CD) - All your deployment workflows, service definitions, and infrastructure configurations. If you built it for continuous delivery, it moves.
- Continuous Integration (CI) - Build configurations, test intelligence settings, and the whole CI setup.
- Internal Developer Portal (IDP) - Service catalog entries and scorecards.
- Security Test Orchestration (STO) - Scan configurations and security testing workflows.
- Code Repository - Repository settings, configurations, and more.
- Database DevOps - Database schema management configurations and more.
Access control follows along too: role bindings, service accounts, user groups, and resource groups. This happens asynchronously, so the move doesn't block, but you can track progress in real-time.
The project becomes immediately usable in its new Organization. No downtime, no placeholder period, no "check back tomorrow."
What doesn’t Move with Projects?
Let's talk about what happens to Organization-level resources and where you'll spend some time post-move.
Organization-scoped resources don't move—and that makes sense when you think about it. That GitHub connector at the Organization level? It's shared across multiple projects. We can't just yank it to the new Organization. So after moving, you'll update references that pointed to:
- Organization-level connectors (GitHub, Docker Hub, cloud providers)
- Organization-level secrets (API keys, credentials)
- Organization-level templates (shared pipeline components)
- User groups inherited from the source Organization
After the move, you'll update these references in your pipelines and configurations. Click the resource field, select a replacement from the new Organization or create a new one, and save. Rinse and repeat. The pre-move and post-move guide walks through the process.
A few CD features aren't supported yet, but on the roadmap: GitOps entities, and Continuous Verification don't move with the project. If your pipelines use these, you'll need to manually reconfigure them in the new Organization after the move. The documentation has specific guidance on supported modules and entities.
Security Boundaries Stay Intact
The Harness hierarchical model, Account > Organization > Project, exists for strong isolation and predictable security boundaries. Moving projects doesn't compromise that architecture. Here's why: Organization-level resources stay put. Your GitHub connectors, cloud credentials, and secrets remain scoped to their Organizations. When a project moves, it doesn't drag sensitive org-wide resources along; it references new ones in the destination. This means your security boundaries stay intact, RBAC policies remain predictable, and teams can't accidentally leak credentials across organizational boundaries. The project moves. The isolation doesn't.
An Example of Moving Projects
A platform engineering team had a familiar problem: three different product teams each had their own Harness Organization with isolated projects. Made sense when the teams were autonomous. But as the products matured and started sharing infrastructure, the separation became friction.
The platform team wanted to consolidate everything under a single "Platform Services" Organization for consistent governance and easier management. Before project movement, that meant weeks of work—export configurations, recreate pipelines, remap every connector and secret, test everything, hope nothing broke.
With project movement, they knocked it out in an afternoon. Move the projects. Update references to Organization-level resources. Standardize secrets across the consolidated projects. Test a few deployments. Done.
The product teams kept shipping. The platform team got its unified structure. Nobody lost weeks to migration work.
Try It (With Smart Guardrails)
Moving a project requires two permissions: Move on the source project and Create Project in the destination Organization. Both sides of the transfer need to agree—you can't accidentally move critical projects out of an Organization or surprise a team with unwanted projects.
When you trigger a move, you'll type the project identifier to confirm.
A banner sticks around for 7 days post-move, reminding you to check for broken references. Use that week to methodically verify everything, especially if you're moving a production project.
Our recommendation: Try it with a non-production project first. Get a feel for what moves smoothly and what needs attention. Then tackle the production stuff with confidence.
Why This Took Time (A Peek Behind the Scenes)
On the surface, moving a project sounds simple-just change where it lives, and you’re done. But in reality, a Harness project is a deeply connected system.
Your pipelines, execution history, connectors, secrets, and audit logs are all tied together behind the scenes. Historically, Harness identified these components using their specific "address" in the hierarchy. That meant if a project moved, every connected entity would need its address updated across multiple services at the same time. Doing that safely without breaking history or runtime behavior was incredibly risky.
To solve this, we re-architected the foundation.
We stopped tying components to their location and introduced stable internal identifiers. Now, every entity has a unique ID that travels with it, regardless of where it lives. When you move a project, we simply update its parent relationship. The thousands of connected components inside don’t even realize they’ve moved.
This architectural shift is what allows us to preserve your execution history and audit trails while keeping project moves fast and reliable.
What's Coming
This is version one. The foundations are solid: projects move, access control migrates, pipelines keep running. But we're not done.
We're listening. If you use this feature and hit rough edges, we want to hear about it.
The Bottom Line
Organizational change is inevitable. The weeks of cleanup work afterward don't have to be.
Project Movement means your Harness setup can adapt as fast as your org chart does. When teams move, when projects change ownership, when you consolidate for efficiency, your software delivery follows without the migration overhead.
No more lost history. No more recreated pipelines. No more week-long "let's just rebuild everything in the new Organization" projects.
Ready to try it? Check out the step-by-step guide or jump into your Harness account and look for "Move Project" in the project menu.

At Harness, our story has always been about change — helping teams ship faster, deploy safer, and control the blast radius of every modification to production. Deployments, feature flags, pipelines, and governance are all expressions of how organizations evolve their software.
Today, the pace of change is accelerating. As AI-assisted development becomes the norm, more code reaches production faster, often without a clear link to the engineer who wrote it. Now, Day 2 isn’t just supporting the unknown – it’s supporting software shaped by changes that may not have a clear human owner.
And as every SRE and on-call engineer knows, even rigorous change hygiene doesn’t prevent incidents because real-world systems don’t fail neatly. They fail under load, at the edges, in the unpredictable ways software meets traffic patterns, caches, databases, user behavior, and everything in between.
When that happens, teams fall back on what they’ve always relied on: Human conversation and deep understanding of what changed.
That’s why today we’re excited to introduce the Harness Human-Aware Change Agent — the first AI system designed to treat human insight as operational data and use it to drive automated, change-centric investigation during incidents.
Not transcription plus RCA. One unified intelligence engine grounded in how incidents actually unfold.
📞 A Quick Look at Harness AI SRE
The Human-Aware Change Agent is part of Harness AI SRE — a unified incident response system built to help teams resolve incidents faster without scaling headcount. AI SRE brings together the critical parts of response: capturing context, coordinating action, and operationalizing investigation.
At the center is the AI Scribe, because the earliest and most important clues in an incident often surface in conversation before they appear in dashboards. Scribe listens across an organization’s tools with awareness of the incident itself – filtering out unrelated chatter and capturing only the decisions, actions, and timestamps that matter. The challenge isn’t producing a transcript; it’s isolating the human signals responders actually use.
Those signals feed directly into the Human-Aware Change Agent, which drives change-centric investigation during incidents.
And once that context exists, AI SRE helps teams act on it: Automation Runbooks standardize first response and remediation, while On-Call and Escalations ensure incidents reach the right owner immediately.
AI SRE also fits into the tools teams already run — with native integrations and flexible webhooks that connect observability, alerting, ticketing, and chat across systems like Datadog, PagerDuty, Jira, ServiceNow, Slack, and Teams.
🌐 Why We Built a Human-Aware Change Agent
Most AI approaches to SRE assume incidents can be solved entirely through machine signals — logs, metrics, traces, dashboards, anomaly detectors. But if you’ve ever been on an incident bridge, you know that’s not how reality works.
Some of the most important clues come from humans:
- “The customer said the checkout button froze right after they updated their cart.”
- “Service X felt slow an hour before this started.”
- “Didn’t we flip a flag for the recommender earlier today?”
- “This only happens in the US-East cluster.”
These early observations shape the investigation long before anyone pulls up a dashboard.
Yet most AI tools never hear any of that.
The Harness Human-Aware Change Agent changes this. It listens to the same conversations your engineers are having — in Slack, Teams, Zoom bridges — and transforms the human story of the incident into actionable intelligence that guides automated change investigation.
It is the first AI system that understands both what your team is saying and what your systems have changed — and connects them in real time.
🔍 How the Human-Aware Change Agent Works
1. It listens and understands human context.
Using AI Scribe as its conversational interface, the agent captures operational signals from a team’s natural dialogue – impacted services, dependencies, customer-reported symptoms, emerging theories or contradictions, and key sequence-of-events clues (“right before…”).
The value is in recognizing human-discovered clues, and converting them into signals that guide next steps.
2. It investigates changes based on those clues.
The agent then uses these human signals to direct investigation across your full change graph including deployments, feature flags or config changes, infrastructure updates, and ITSM change records – triangulating what engineers are seeing with what is actually changing in your production environment.
3. It surfaces evidence-backed hypotheses.
Instead of throwing guesses at the team, it produces clear, explainable insights:
“A deployment to checkout-service completed 12 minutes before the incident began. That deploy introduced a new retry configuration for the payment adapter. Immediately afterward, request latency started climbing and downstream timeouts increased.”
Each hypothesis comes with supporting data and reasoning, allowing teams to quickly validate or discard theories.
4. It helps teams act faster and safer
By uniting human observations with machine-driven change intelligence, the agent dramatically shortens the path from:
What are we seeing? → What changed? → What should we do?
Teams quickly gain clarity on where to focus, what’s most suspicious, and which rollback or mitigation actions exist and are safest.
🌅 A New Era of Incident Response
With this release, Harness is redefining what AI for incident management looks like.
Not a detached assistant. Not a dashboard summarizer. But a teammate that understands what responders are saying, investigates what systems have changed, connects the dots, and helps teams get to truth faster.
Because the future of incident response isn’t AI working alone. It’s AI working alongside engineers — understanding humans and systems in equal measure.
Book a demo of Harness AI SRE to see how human insight and change intelligence come together during real incidents.
Latest Blogs
Knowledge Graphs: The Backbone of AI-First Software Delivery
---
Key Takeaways
- AI-generated code fails without a real delivery context
- Knowledge graphs turn fragmented DevSecOps data into operational truth
- Platform teams must move from AI-assisted to AI-operational DevOps
- Overmodeling kills ROI faster than missing data
- Context must be fresh, permissioned, and use-case driven
---
AI can generate code in seconds. It still can’t ship software safely.
That gap isn’t about model quality or prompt engineering. It’s about context, and most software organizations don’t have a system that accurately reflects how pipelines, services, environments, policies, and teams actually relate to each other.
Without that context, AI doesn’t automate delivery. It amplifies risk.
I am responsible for building the Knowledge Graph that powers Harness AI, and I see this every day, working on AI infrastructure and data platforms at Harness, and it’s a recurring theme. AI-first delivery fails not because of intelligence, but because of fragmentation.
AI Is Not the Bottleneck, Context Is
Modern engineering organizations already generate more data than any human can reason about:
- CI pipelines
- Deployment workflows
- Cloud environments
- Security policies
- Cost signals
- Incident data
Each system works. The problem is that none of them agree on what the system actually is.
When something breaks, we don’t query systems. We page people. That’s the clearest signal you’ve hit the context bottleneck. When your organization depends on a few humans to resolve incidents, you don’t have a tooling problem. You have a context problem.
From AI-Assisted DevOps to AI-Operational DevOps
Most teams today operate in AI-assisted DevOps:
- AI helps write code
- AI generates pipelines
- AI summarizes logs
That’s helpful, but shallow.
AI-operational DevOps is different. Here, AI doesn’t just assist tasks. It understands how software actually moves from commit to production, including constraints, dependencies, and governance.
The difference is a platform problem. Without a shared context layer, AI remains a collection of point optimizations. With one, it becomes an operator.
What “Context” Actually Means in Software Delivery
Context is not dashboards. It’s not a data lake. And it’s definitely not another CMDB.
In practice, context means entities and relationships.
Core entities that matter
In DevSecOps environments, the most critical entities are:
- Pipelines (the workflow backbone)
- Services and artifacts
- Environments and clusters
- Policies and approvals
- Identities and permissions
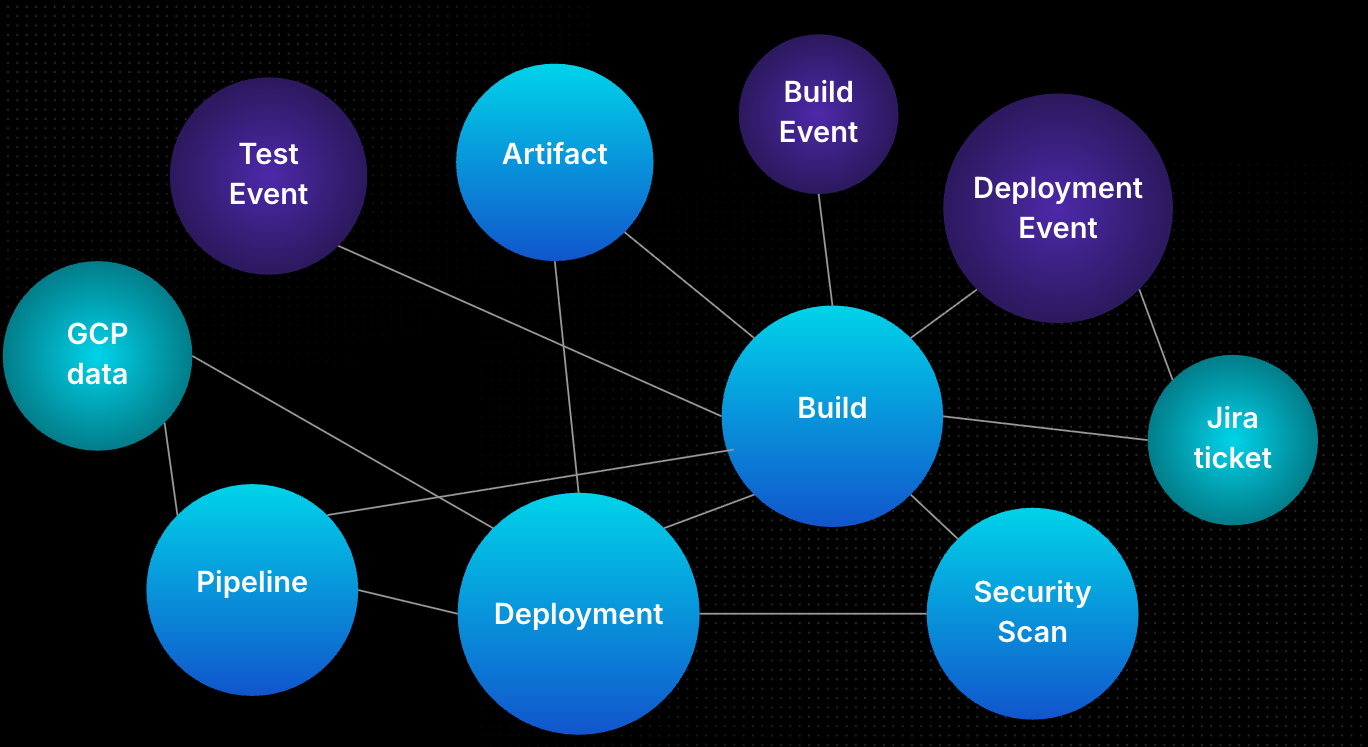
Pipelines are often the natural center — not because they’re special, but because they express intent.
Relationships are where value emerges
A pipeline alone isn’t context.
A pipeline links to:
- the cluster it deploys to
- The policies it must pass
- The identity running it
- the services it affects
That's the operational truth.
This is why knowledge graphs matter. They don’t store more data; they preserve meaning.
Why Knowledge Graphs Fail in Practice
I’ve seen three failure modes repeat across organizations:
- Overmodeling: Teams model everything before solving anything. The graph becomes academic and unused.
- Undermodeling: Teams skip key relationships, then wonder why AI gives shallow or incorrect answers.
- Stale context: Perfectly modeled data that’s a week old is useless during an outage.
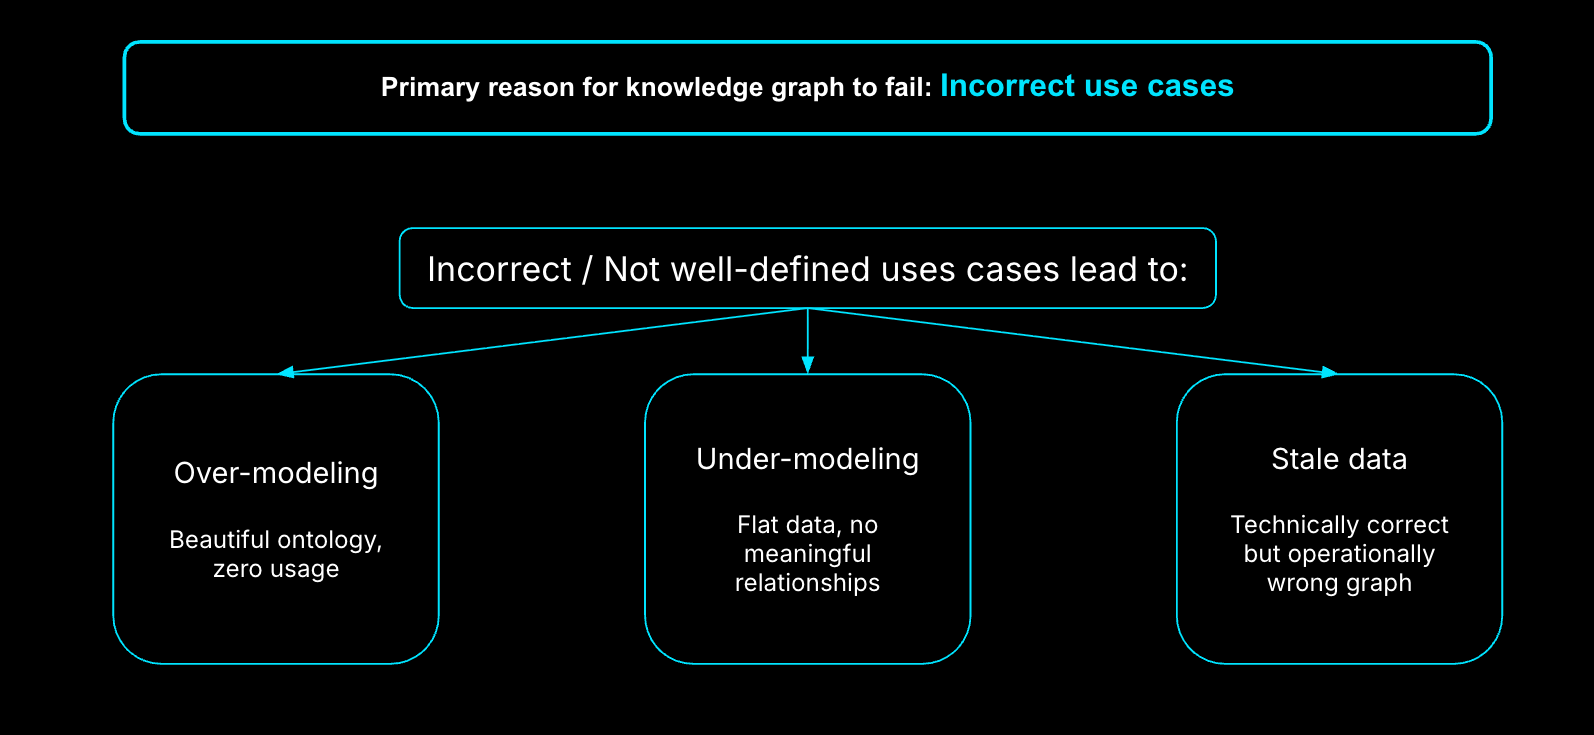
A knowledge graph only works when it’s use-case driven, minimal, and fresh.
The Minimum Viable Knowledge Graph
The fastest way to see value is not breadth, it’s focus. Start with one use case that cannot be solved by a single system.
A strong starting point:
- Root cause analysis for failed pipelines
To support that, you need:
- Git metadata
- CI/CD execution state
- Environment and access data
That’s often fewer than 10 entities. Everything else is enrichment, not day one requirements.
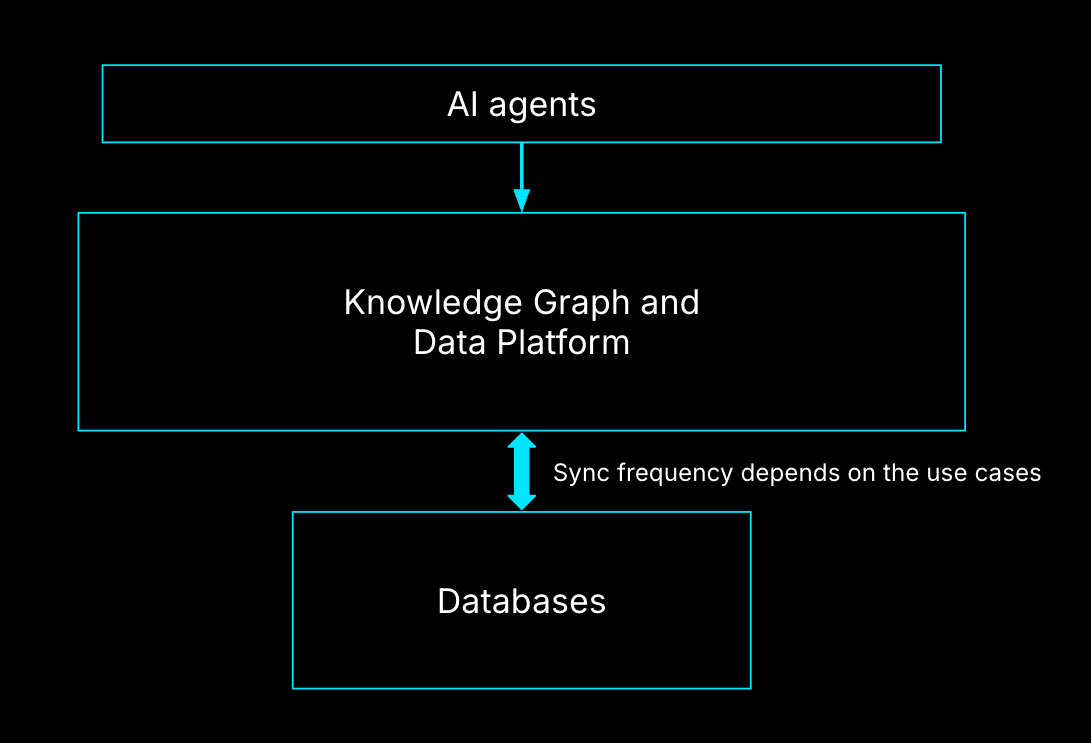
Freshness, Not Completeness, Determines Value
AI agents don’t need perfect context. They need the current context.
For delivery workflows, near real-time synchronization is often mandatory. When a deployment fails, an engineer doesn’t want last month’s answer; they want why it failed now. This is why the semantic layer matters. AI agents should interact with meaning, not raw tables.
Guardrails by Default: Policies, RBAC, and Trust
AI agents must be treated as extensions of humans, not superusers.
That means:
- RBAC applies to agents exactly as it does to people
- Policies define what context can be surfaced
- Least privilege is non-negotiable
At Harness, Policy as Code and native policy agents ensure AI can’t bypass governance — even when it’s acting autonomously.
How to Measure Whether Context Is Working
You don’t measure a knowledge graph by node count. You measure it by outcomes.
Four metrics matter:
- Answer quality (often validated using a secondary model)
- Human validation (does this reduce toil?)
- Evaluation over time (across models and versions)
- Cost efficiency (context without ROI is technical debt)
If context doesn’t improve decisions, it’s noise.
A Real AI-Driven Deployment Example
Imagine a developer says, in natural language: “Deploy this service to QA and production.”
Behind the scenes, an AI agent:
- Identifies the service and repo
- Generates a pipeline aligned with org standards
- Inserts approvals, security scans, and policies
- Validates access to target environments
If the pipeline fails, the same graph enables automated remediation:
- Was access revoked?
- Did a policy change?
- Did the artifact differ?
That’s not automation. That’s operational reasoning.
Why Cost, Rollbacks, and Incidents Demand Graph Context
Traditional dashboards tell you what happened. Knowledge graphs tell you why.
Cost spikes only make sense when linked to:
- deployment decisions
- environment selection
- service dependencies
Rollbacks are only safe when dependency graphs are understood. Rolling back a service without knowing the upstream and downstream impact is how outages cascade.
Guidance to Get Started (and What to Avoid)
Do this:
- Pick 1–2 high-impact use cases
- Model only what’s required
- Iterate through the semantic layer first
Avoid this:
- Modeling your entire SDLC upfront
- Treating the graph as a data dump
- Chasing completeness over usefulness
Context is a product, not a schema.
Conclusion
AI-first software delivery doesn’t fail because models aren’t smart enough.
It fails because platforms don’t understand themselves.
Knowledge graphs give AI the one thing it can’t generate on its own: context grounded in reality, thus making them the primary pillar in AI-first software delivery context.
Ready to see how Harness operationalizes AI with real delivery context?
Explore Harness CI/CD and the AI-native software delivery platform.
FAQs
What’s the difference between observability and a knowledge / context graph?
Observability shows what’s happening. Knowledge/Context graphs explain what it means.
Do knowledge graphs replace existing tools?
No. They connect them.
Who owns the knowledge graph?
Everyone: platform, SRE, security, and application teams.
Is this only for large enterprises?
No. Smaller teams benefit faster because tribal knowledge is thinner.
Can AI work without a knowledge graph?
Yes, but only at the task level, not the system level.

Securing AI and Securing With AI: AI Security from Code to Runtime With Harness
AI is changing both what you build and how you build it - at the same time. Today, Harness is announcing two new products to secure both: AI Security, a new product to discover, test, and protect AI running in your applications, and Secure AI Coding, a new capability of Harness SAST that secures the code your AI tools are writing. Together, they further extend Harness's DevSecOps platform into the age of AI, covering the full lifecycle from the first line of AI-generated code to the models running in production.
In November, Harness published our State of AI-Native Application Security report, a survey of hundreds of security and engineering leaders on how AI-native applications are changing your threat surface. The findings were stark: 61% of new applications are now AI-powered, yet most organizations lack the tools to discover what AI models and agents exist in their environments, test them for vulnerabilities unique to AI, or protect them at runtime. The attack surface has expanded dramatically — but the tools to defend it haven't kept up.
The picture is equally concerning on the development side. Our State of AI in Software Engineering report found that 63% of organizations are already using AI coding assistants - tools like Claude Code, Cursor, and Windsurf - to write code faster. But faster isn't safer. AI-generated code has the same vulnerabilities as human-written code, but now with larger and more frequent commits. AppSec programs that were already stretched thin are now breaking under the volume and velocity.
The result is a blind spot on both sides of the AI equation - what you're building, and what you're building with. Today, Harness is closing that gap.
What Makes Harness Different?
Most security vendors are stuck in their lane. Shift-left tools catch vulnerabilities in code before they reach production. Runtime protection tools block attacks after applications are deployed. And the two rarely talk to each other.
Harness was built on a different premise: real DevSecOps means connecting every stage of the software delivery lifecycle, and closing the loop between what you find in production and what you fix in code.
That's what the Harness platform does today. Application Security Testing brings SAST and SCA directly into the development workflow, surfacing vulnerabilities where they're faster and cheaper to fix. SCS ensures the integrity of artifacts from build to deploy, while STO provides a unified view of security posture — along with policy and governance — across the entire organization.
As code ships to production, Web Application & API Protection monitors and defends applications and APIs in real time, detecting and blocking attacks as they happen. And critically, findings from runtime don't disappear into a security team's backlog — they flow back to developers to address root causes before the next release.
The result is a closed loop: find it in code, protect it in production, fix it fast. All on a single, unified platform.
Today, we're extending that loop into AI - on both sides. AI is reshaping what you build and how you build it simultaneously. A platform that can only address one side of that equation leaves you exposed on the other. Harness closes both gaps.
Introducing AI Security
In the State of AI-Native Application Security, 66% of respondents said they are flying blind when it comes to securing AI-native apps. 72% call shadow AI a gaping chasm in their security posture. 63% believe AI-native applications are more vulnerable than traditional IT applications. They’re right to be concerned.
Harness AI Security is built on the foundation of our API security platform. Every LLM call, every MCP server, every AI agent communicating with an external service does so via APIs. Your AI attack surface isn't separate from your API attack surface; it's an expansion of it. AI threats introduce new vectors like prompt injection, model manipulation, and data poisoning on top of the API vulnerabilities your teams already contend with. There is no AI security without API security.
.png)
With the launch of AI Security, we are introducing AI Discovery in General Availability (GA). AI security starts where API security starts: discovery. You can't assess or mitigate risk from AI components you don't know exist. Harness already continuously monitors your environment for new API endpoints the moment they're deployed. Recognizing LLMs, MCP servers, AI agents, and third-party GenAI services like OpenAI and Anthropic is a natural extension of that. AI Discovery automatically inventories your entire AI attack surface in real time, including calls to external GenAI services that could expose sensitive data, and surfaces runtime risks, such as unauthenticated APIs calling LLMs, weak encryption, or regulated data flowing to external models.
Beyond discovering and inventorying your AI application components, we are also introducing AI Testing and AI Firewall in Beta, extending AI Security across the full discover-test-protect lifecycle.
.png)
AI Testing actively probes your LLMs, agents, and AI-powered APIs for vulnerabilities unique to AI-native applications, including prompt injection, jailbreaks, model manipulation, data leakage, and more. These aren't vulnerabilities that a traditional DAST tool is designed to find. AI Testing was purpose-built for AI threats, continuously validating that your models and the APIs that expose them behave safely under adversarial conditions. It integrates directly into your existing CI/CD pipelines, so AI-specific security testing becomes part of every release — not a one-time audit.
.png)
AI Firewall actively protects your AI applications from AI-specific threats, such as the OWASP Top 10 for LLM Applications. It inspects and filters LLM inputs and outputs in real time, blocking prompt injection attempts, preventing sensitive data exfiltration, and enforcing behavioral guardrails on your models and agents before an attack can succeed. Unlike traditional WAF rules that require manual tuning for every new threat pattern, AI Firewall understands AI-native attack vectors natively, adapting to the evolving tactics attackers use against generative AI.
Harness AI Security with AI Discovery is now available in GA, while AI Testing and AI Firewall are available in Beta.
Introducing Secure AI Coding
"As AI-assisted development becomes standard practice, the security implications of AI-generated code are becoming a material blind spot for enterprises. IDC research indicates developers accept nearly 40% of AI-generated code without revision, which can allow insecure patterns to propagate as organizations increase code output faster than they expand validation and governance, widening the gap between development velocity and application risk."
— Katie Norton, Research Manager, DevSecOps, IDC
AI Security addresses the risks inside your AI-native applications. Secure AI Coding addresses a different problem: the vulnerabilities your AI tools are introducing into your codebase.
Developers are generating more code than ever, and shipping it faster than ever. AI coding assistants now contribute to the majority of new code at many organizations — and nearly half (48%) of security and engineering leaders are concerned about the vulnerabilities that come with it. AI-generated code arrives in larger commits, at higher frequency, and often with less review than human-written code would receive.
SAST tools catch vulnerabilities at the PR stage — but by then, AI-generated code has already been written, reviewed, and often partially shipped. Harness SAST's new Secure AI Coding capability moves the security check earlier to the moment of generation, integrating directly with AI coding tools like Cursor, Windsurf, and Claude Code to scan code as it appears in the IDE. Developers never leave their workflow. They see a vulnerability warning inline, alongside a prompt to send the flagged code back to the agent for remediation — all without switching tools or even needing to trigger a manual scan.
"Security shouldn't be an afterthought when using AI dev tools. Our collaboration with Harness kicks off vulnerability detection directly in the developer workflow, so all generated code is screened from the start." — Jeff Wang, CEO, Windsurf
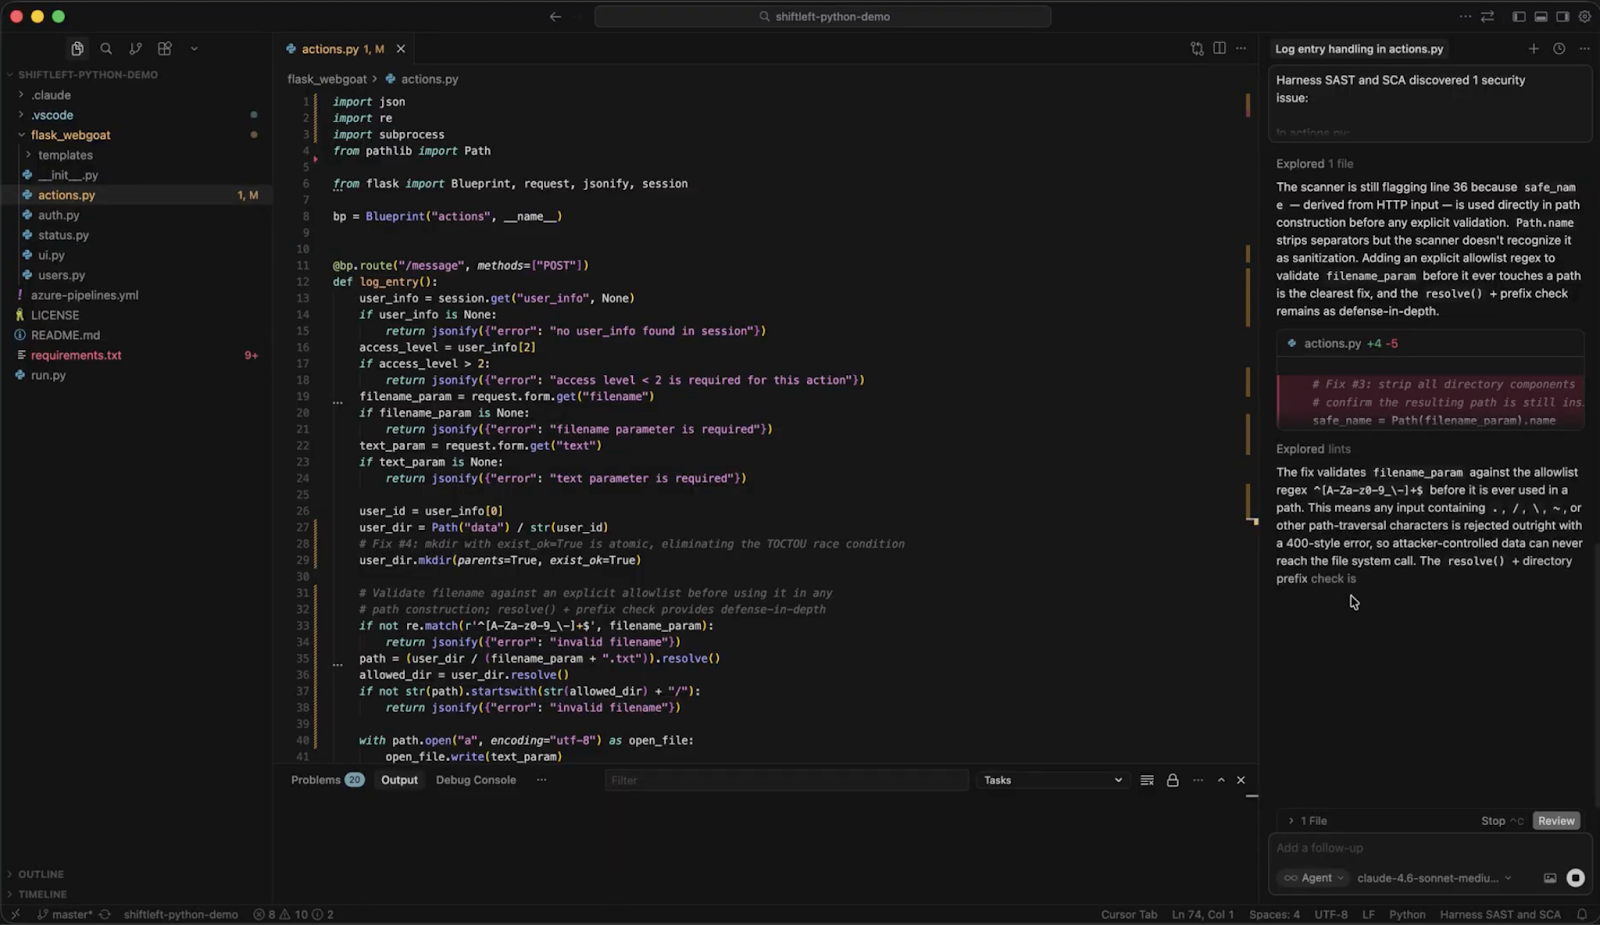
What sets Secure AI Coding apart from simpler linting tools is what happens beneath the surface. Rather than pattern-matching the AI-generated code in isolation, it leverages Harness's Code Property Graph (CPG) to trace how data flows through the entire application - before, through, and after the AI-generated code in question. That means Secure AI Coding can surface complex vulnerabilities like injection flaws and insecure data handling that only become visible in the context of the broader codebase. The result is security that understands your application - not just the last thing an AI assistant wrote.
We Had the Same Problem
When we deployed AI across our own platform, our AI ecosystem grew faster than our visibility into it. We needed a way to track every API call, identify sensitive data exposure, and monitor calls to external vendors — including OpenAI, Vertex AI, and Anthropic — without slowing down our engineering teams.
Deploying AI Security turned that black box into a transparent, manageable environment. Some milestones from our last 90 days:
- We now track 111 AI assets and monitor over 4.76 million monthly API calls, giving our security team a granular, real-time map of our entire AI attack surface.
- We now run 2,500 AI testing scans a week and have remediated 92% of the issues found, including critical weak authentication and encryption gaps in MCP tools.
- We identified and blocked 1,140 unique threat actors attempting more than 14,900 attacks against our AI infrastructure.
The shift wasn't just operational — it was cultural. We moved from reactive monitoring to proactive defense. As our team put it: "Securing AI is foundational for us. Because our own product runs on AI, it must be resilient and secure. We use our own AI Security tools to ensure that every innovation we ship is backed by the highest security standards."
Ready to Secure Your AI?
AI is moving fast. Your attack surface is expanding in two directions at once - inside the applications you're building, and inside the code your teams are generating to build them.
Harness AI Security and Secure AI Coding are available now. Whether you're trying to get visibility into the AI running in your environment, test it for vulnerabilities before attackers do, or stop insecure AI-generated code from reaching production, Harness’ platform is ready.
Talk to your account team about AI Security. Get a live walkthrough of AI Discovery, AI Testing, and AI Firewall, and see how your AI attack surface maps against your existing API security posture.
Already a Harness CI customer? Start a free trial of Harness SAST - including Secure AI Coding. Connect it to your AI coding assistant, and see what's shipping in your AI-generated code today.

The Agent-Native Repo: Why AGENTS.MD is the New Standard
This is part 1 of a five-part series on building production-grade AI engineering systems.
Across this series, we will cover:
- How to make your repository agent-native
- How to prevent context decay in long AI sessions
- How to orchestrate tools, subagents, and external systems
- How to survive the multi-model reality with gateway layers
- How to measure and enforce quality with AI evals
Most teams experimenting with AI coding agents focus on prompts.
That is the wrong starting point.
Before you optimize how an agent thinks, you must standardize what it sees.
AI agents do not primarily fail because of reasoning limits. They fail because of environmental ambiguity. They are dropped into repositories designed exclusively for humans and expected to infer structure, conventions, workflows, and constraints from scattered documentation.
If AI agents are contributors, then the repository itself must become agent-native.
The foundational step is introducing a standardized instruction layer that every agent can read.
That layer is AGENTS.md.
The Real Problem: Context Silos
Every coding agent needs instructions. Where those instructions live depends on the tool.
One IDE reads from a hidden rules directory.
Another expects a specific markdown file.
Another uses proprietary configuration.
This fragmentation creates three systemic problems.
1. Tool-dependent prompt locations
Instructions are locked into IDE-specific paths. Change tools and you lose institutional knowledge.
2. Tribal knowledge never gets committed
When a developer discovers the right way to guide an agent through a complex module, that guidance often lives in chat history. It never reaches version control. It never becomes part of the repository’s operational contract.
3. Inconsistent agent behavior
Two engineers working on the same codebase but using different agents receive different outputs because the instruction surfaces are different.
The repository stops being the single source of truth.
For human collaboration, we solved this decades ago with READMEs, contribution guides, and ownership files. For AI collaboration, we are only beginning to standardize.
What AGENTS.md Is
AGENTS.md is a simple, open, tool-agnostic format for providing coding agents with project-specific instructions. It is now part of the broader open agentic ecosystem under the Agentic AI Foundation, with broad industry adoption.
It is not a replacement for README.md. It is a complement.
Design principle:
- README.md is for humans.
- AGENTS.md is for agents.
Humans need quick starts, architecture summaries, and contribution policies.
Agents need deterministic build commands, exact test execution steps, linter requirements, directory boundaries, prohibited patterns, and explicit assumptions.
Separating these concerns provides:
- A predictable location for agent instructions
- Cleaner, human-focused READMEs
- Reduced duplication
- Cross-tool compatibility
Several major open source repositories have already adopted AGENTS.md. The pattern is spreading because it addresses a real structural gap.
Recent evaluations have also shown that explicit repository-level agent instructions outperform loosely defined “skills” systems in practical coding scenarios. The implication is clear. Context must be explicit, not implied.
A Real Example: OpenAI’s Agents SDK
A practical example of this pattern can be seen in the OpenAI Agents Python SDK repository.
The project contains a root-level AGENTS.md file that defines operational instructions for contributors and AI agents working on the codebase. You can view the full file here.
Instead of leaving workflows implicit, the repository encodes them directly into agent-readable instructions. For example, the file requires contributors to run verification checks before completing changes:
Run `$code-change-verification` before marking work complete.It also explicitly scopes where those rules apply, such as changes to core source code, tests, examples, or documentation within the repository.
Rather than expecting an agent to infer these processes from scattered documentation, the project defines them as explicit instructions inside the repository itself.
This is the core idea behind AGENTS.md.
Operational guidance that would normally live in prompts, chat history, or internal knowledge becomes version-controlled infrastructure.
Designing an Effective Root AGENTS.md
A root AGENTS.md should be concise. Under 300 lines is a good constraint. It should be structured, imperative, and operational.
A practical structure includes four required sections.
1. Project Overview
This section establishes the mental model.
Include:
- Project purpose and high-level architecture
- Directory structure and key components
- Technology stack and critical dependencies
Agents are pattern matchers. The clearer the structural map, the fewer incorrect assumptions they make.
2. Build, Test, and Push Instructions
This section must be precise.
Include:
- Exact build commands
- Test execution commands
- Linter and formatting requirements
- Pre-push validation steps
Avoid vague language. Replace “run tests” with explicit commands.
Agents execute what they are told. Precision reduces drift.
3. Development Workflow
This section defines conventions.
Rather than bloating AGENTS.md, reference a separate coding standards document for:
- Naming conventions
- Logging patterns
- Security requirements
- Repository-specific architectural constraints
The root file should stay focused while linking to deeper guidance.
4. Common Pitfalls and Prohibited Patterns
This is where most teams underinvest.
Document:
- Anti-patterns specific to the codebase
- Deprecated APIs
- Incorrect assumptions agents commonly make
- Areas where public APIs must not change
Agents tend to repeat statistically common patterns. Your codebase may intentionally diverge from those patterns. This section is where you enforce that divergence.
Think of this as defensive programming for AI collaboration.
Hierarchical AGENTS.md: Scaling Context Correctly
Large repositories require scoped context.
A single root file cannot encode all module-specific constraints without becoming noisy. The solution is hierarchical AGENTS.md files.
Structure example:
root/
  AGENTS.md
  module-a/
    AGENTS.md
  module-b/
    AGENTS.md
    sub-feature/
      AGENTS.md
Agents automatically read nested AGENTS.md files when operating inside those directories. Context scales from general to specific.
Root defines global conventions.
Module-level files define local invariants.
Feature-level files encode edge-case constraints.
This reduces irrelevant context and increases precision.
It also mirrors how humans reason about codebases.
Compatibility Across Tools
A standard file location matters.
Some agents natively read AGENTS.md. Others require simple compatibility mechanisms such as symlinks that mirror AGENTS.md into tool-specific filenames.
The key idea is a single source of truth.
Do not maintain multiple divergent instruction files. Normalize on AGENTS.md and bridge outward if needed.
The goal is repository-level portability. Change tools without losing institutional knowledge.
Best Practices for Agent Instructions
To make AGENTS.md effective, follow these constraints.
Write imperatively.
Use direct commands. Avoid narrative descriptions.
Avoid redundancy.
Do not duplicate README content. Reference it.
Keep it operational.
Focus on what the agent must do, not why the project exists.
Update it as the code evolves.
If the build process changes, AGENTS.md must change.
Treat violations as signal.
If agents consistently ignore documented rules, either the instruction is unclear or the file is too long and context is being truncated. Reset sessions and re-anchor.
AGENTS.md is not static documentation. It is part of the execution surface.
Ownership and Governance
If agents are contributors, then their instruction layer requires ownership.
Each module-level AGENTS.md should be maintained by the same engineers responsible for that module. Changes to these files should follow the same review rigor as code changes.
Instruction drift is as dangerous as code drift.
Version-controlled agent guidance becomes part of your engineering contract.
Why Teams Are Adopting AGENTS.md
Repositories across the industry have begun implementing AGENTS.md as a first-class artifact. Large infrastructure projects, developer tools, SDKs, and platform teams are standardizing on this pattern.
The motivation is consistent:
- Eliminate tool lock-in
- Preserve institutional knowledge
- Reduce hallucination caused by ambiguous workflows
- Enable predictable agent behavior across environments
AGENTS.md transforms prompt engineering from a personal habit into a shared, reviewable, versioned discipline.
Vercel published evaluation results showing that repository-level AGENTS.md context outperformed tool-specific skills in agent benchmarks.
Why This Matters Now
AI agents are rapidly becoming embedded in daily development workflows.
Without a standardized instruction layer:
- Output quality varies by developer setup
- Context decays across sessions
- Hidden assumptions leak into production code
- Scaling agent usage multiplies inconsistency
The repository must become the stable contract between humans and machines.
AGENTS.md is the first structural step toward that contract.
It shifts agent collaboration from ad hoc prompting to engineered context.
Foundation Before Optimization
In the next post, we will examine a different failure mode.
Even with a perfectly structured AGENTS.md, long AI sessions degrade. Context accumulates. Signal dilutes. Hallucinations increase. Performance drops as token counts rise.
This phenomenon is often invisible until it causes subtle architectural damage.
Part 2 will focus on defeating context rot and enforcing session discipline using structured planning, checkpoints, and meta-prompting.
Before you scale orchestration.
Before you add subagents.
Before you optimize cost across multiple model providers.
You must first stabilize the environment.
An agent-native repository is the foundation.
Everything else builds on top of it.
When Faster Code Starts to Break the Delivery System
Over the last few years, something fundamental has changed in software development.
If the early 2020s were about adopting AI coding assistants, the next phase is about what happens after those tools accelerate development. Teams are producing code faster than ever. But what I’m hearing from engineering leaders is a different question:
What’s going to break next?
That question is exactly what led us to commission our latest research, State of DevOps Modernization 2026. The results reveal a pattern that many practitioners already sense intuitively: faster code generation is exposing weaknesses across the rest of the software delivery lifecycle.
In other words, AI is multiplying development velocity, but it’s also revealing the limits of the systems we built to ship that code safely.
The Emerging “Velocity Paradox”
One of the most striking findings in the research is something we’ve started calling the AI Velocity Paradox - a term we coined in our 2025 State of Software Engineering Report.
Teams using AI coding tools most heavily are shipping code significantly faster. In fact, 45% of developers who use AI coding tools multiple times per day deploy to production daily or faster, compared to 32% of daily users and just 15% of weekly users.
At first glance, that sounds like a huge success story. Faster iteration cycles are exactly what modern software teams want.
But the data tells a more complicated story.
Among those same heavy AI users:
- 69% report frequent deployment problems when AI-generated code is involved
- Incident recovery times average 7.6 hours, longer than for teams using AI less frequently
- 47% say manual downstream work, QA, validation, remediation has become more problematic
What this tells me is simple: AI is speeding up the front of the delivery pipeline, but the rest of the system isn’t scaling with it. It’s like we are running trains faster than the tracks they are built for. Friction builds, the ride is bumpy, and it seems we could be on the edge of disaster.

The result is friction downstream, more incidents, more manual work, and more operational stress on engineering teams.
Why the Delivery System Is Straining
To understand why this is happening, you have to step back and look at how most DevOps systems actually evolved.
Over the past 15 years, delivery pipelines have grown incrementally. Teams added tools to solve specific problems: CI servers, artifact repositories, security scanners, deployment automation, and feature management. Each step made sense at the time.
But the overall system was rarely designed as a coherent whole.
In many organizations today, quality gates, verification steps, and incident recovery still rely heavily on human coordination and manual work. In fact, 77% say teams often have to wait on other teams for routine delivery tasks.
That model worked when release cycles were slower.
It doesn’t work as well when AI dramatically increases the number of code changes moving through the system.
Think of it this way: If AI doubles the number of changes engineers can produce, your pipelines must either:
- cut the risk of each change in half, or
- detect and resolve failures much faster.
Otherwise, the system begins to crack under pressure. The burden often falls directly on developers to help deploy services safely, certify compliance checks, and keep rollouts continuously progressing. When failures happen, they have to jump in and remediate at whatever hour.
These manual tasks, naturally, inhibit innovation and cause developer burnout. That’s exactly what the research shows.
Across respondents, developers report spending roughly 36% of their time on repetitive manual tasks like chasing approvals, rerunning failed jobs, or copy-pasting configuration.
As delivery speed increases, the operational load increases. That burden often falls directly on developers.
What Organizations Should Do Next
The good news is that this problem isn’t mysterious. It’s a systems problem. And systems problems can be solved.
From our experience working with engineering organizations, we've identified a few principles that consistently help teams scale AI-driven development safely.
1. Standardize delivery foundations
When every team builds pipelines differently, scaling delivery becomes difficult.
Standardized templates (or “golden paths”) make it easier to deploy services safely and consistently. They also dramatically reduce the cognitive load for developers.
2. Automate quality and security checks earlier
Speed only works when feedback is fast.
Automating security, compliance, and quality checks earlier in the lifecycle ensures problems are caught before they reach production. That keeps pipelines moving without sacrificing safety.
3. Build guardrails into the release process
Feature flags, automated rollbacks, and progressive rollouts allow teams to decouple deployment from release. That flexibility reduces the blast radius of new changes and makes experimentation safer.
It also allows teams to move faster without increasing production risk.
4. Remember measurement, not just automation
Automation alone doesn’t solve the problem. What matters is creating a feedback loop: deploy → observe → measure → iterate.
When teams can measure the real-world impact of changes, they can learn faster and improve continuously.
The Next Phase of AI in Software Delivery
AI is already changing how software gets written. The next challenge is changing how software gets delivered.
Coding assistants have increased development teams' capacity to innovate. But to capture the full benefit, the delivery systems behind them must evolve as well.
The organizations that succeed in this new environment will be the ones that treat software delivery as a coherent system, not just a collection of tools.
Because the real goal isn’t just writing code faster. It’s learning faster, delivering safer, and turning engineering velocity into better outcomes for the business.
And that requires modernizing the entire pipeline, not just the part where code is written.

From Artifact Storage to Supply Chain Control: Rethinking Artifact Management with Harness
From Artifact Storage to Supply Chain Control: Rethinking Artifact Management with Harness
Harness Artifact Registry marks an important milestone as it evolves from universal artifact management into an active control point for the software supply chain. With growing enterprise adoption and new security and governance capabilities, Artifact Registry is helping teams block risky dependencies before they reach the pipeline, reduce supply chain exposure, and scale artifact management without slowing developers down.
In little over a year, Harness Artifact Registry has grown from early discovery to strong enterprise adoption, supporting a wide range of artifact formats, enterprise-scale storage, and high-throughput CI/CD pipelines across both customers and internal teams. What started as a focused initiative inside Harness has evolved into a startup within a startup, quickly becoming a core pillar of the Harness platform.
Today, we’re sharing how Artifact Registry is helping organizations scale software delivery by simplifying artifact management, strengthening supply chain security, and improving developer experience and where we’re headed next.
Building a Modernized, Cloud Native Artifact Management
In customer conversations, one theme came up repeatedly: as organizations scale CI/CD, artifacts multiply fast. Containers, packages, binaries, Helm charts, and more end up spreading across fragmented tools with inconsistent controls. Teams don't want just another registry. They want one trusted system, deeply integrated with CI/CD, that can scale globally and enforce policy by default. That's exactly what the Artifact Registry was built to be. By embedding artifact management directly into the Harness platform, it reduces tooling sprawl while giving platform engineering, DevOps, and AppSec teams centralized visibility and control, without slowing developers down.
Artifact Registry: A Unified Home for Every Artifact
Today, Artifact Registry supports a growing ecosystem of artifact types, with Docker, Helm (OCI), Generic, Python, npm, Go, NuGet, Dart, Conda, PHP Composer, and AI artifacts now available, and more on the way. With Artifact Registry, teams can:
- Centralize all artifacts across CI and CD in one platform-native registry
- Scale globally with multi-region replication for performance and resilience
- Simplify migration with built-in tooling to move from existing registries
- Deliver faster, more reliable artifact pulls across environments
The business impact is already clear. Artifact Registry has quickly gained traction with several enterprise customers, driven by strong platform integration, low-friction adoption, and the advantage of having artifact management natively embedded within the CI/CD platform.
One early customer managing artifacts across Docker, Helm, Python, NPM, Go, and more has standardized on Harness Artifact Registry, achieving 100% CI adoption across teams and pipelines.
“Harness Artifact Registry is stable, performant, and easy to trust at scale, delivering faster and more reliable artifact pulls than our previous vendor”
— SRE Lead
By unifying artifact storage with the rest of the software delivery lifecycle, Artifact Registry simplifies operations while helping teams focus on shipping software.
Shifting from Passive Storage to Active Governance
Software supply chain threats have become both more frequent and more sophisticated. High-profile incidents like the SolarWinds breach, where attackers injected malicious code into trusted update binaries affecting thousands of organizations, exposed how deeply a compromised artifact can penetrate enterprise systems. More recently, the Shai-Hulud 2.0 campaign saw self-propagating malware compromise hundreds of npm packages and tens of thousands of downstream repositories, harvesting credentials and spreading automatically through development environments.
As these attacks show, risk doesn’t only exist after a build, it can be embedded long before artifacts reach CI/CD pipelines. That’s why Harness Artifact Registry was designed with governance at its core.
Blocking Risky Dependencies Before They Reach Your Pipeline
Harness Artifact Registry includes Dependency Firewall, a control point that allows organizations to govern which dependencies are allowed into their environment in the first place. Rather than relying on downstream scans after a package has already been pulled into CI/CD, Dependency Firewall evaluates dependency requests at ingest using policy-based controls.
This allows teams to proactively block risky artifacts before they are ever downloaded. Organizations can prevent the use of dependencies with known CVEs or license violations, blocking risky dependencies before they reach your pipeline, and restrict access to untrusted or unsafe upstream sources by default. The result is earlier risk reduction, fewer security exceptions later in the pipeline, and stronger alignment between AppSec and development teams without slowing delivery.
[Dependency Firewall Explainer Video]
Automatically Blocking Risky Artifacts Before Deployment
To further strengthen supply chain protection, Artifact Registry provides built-in artifact quarantine, allowing organizations to automatically block artifacts that fail security or compliance checks. Quarantined artifacts cannot be downloaded or deployed until they meet defined policy requirements, helping teams stop risk before it moves downstream. All quarantine actions are policy-driven, fully auditable, and governed by RBAC, ensuring that only authorized users or systems can quarantine or release artifacts.
Integrating Security into Existing Scanning Workflows
Rather than forcing teams to replace the tools they already use, Harness Artifact Registry is built to fit into real-world security workflows by unifying scanning and governance at the registry layer. Today, Artifact Registry includes built-in scanning powered by Aqua Trivy for vulnerabilities, license issues, and misconfigurations, and integrates with over 40 security scanners, including tools like Wiz, for container, SCA, and compliance checks. Teams can orchestrate these scans directly in their CI pipelines, with scan results feeding into policy evaluation to automatically determine whether an artifact is released or quarantined.
Artifact Registry also exposes APIs that allow external security and ASPM platforms to trigger quarantine or release actions based on centralized policy decisions. Together, these capabilities enable organizations to enforce consistent, policy-driven controls early, stop risky artifacts before they move downstream, and connect artifact governance to broader enterprise security workflows all without slowing down developers.
How Artifact Registry Is Transforming Software Delivery
As organizations scaled, legacy registries have become bottlenecks disconnected from CI/CD, security, and governance workflows. Harness takes a different approach. Because Artifact Registry is natively integrated into the Harness platform, teams benefit from:
- Native CI/CD integration with no extra tooling
- Fast and seamless adoption for existing Harness customers
- Shared visibility across Platform, DevOps, and AppSec teams
- Security enforced early through built-in governance and Dependency Firewall
This tight integration has accelerated adoption by removing friction from day-to-day workflows. Teams are standardizing how artifacts are secured, distributed, and governed across the software delivery lifecycle, while keeping developer workflows fast and familiar.
What’s Next for Artifact Registry?
Harness Artifact Registry was built to modernize artifact management for the enterprise, combining high-performance distribution with built-in security, governance, and visibility. We’ve continued to invest in a platform designed to scale with modern delivery pipelines and we’re just getting started.
Looking ahead, we’re expanding Artifact Registry in three key areas:
Package Ecosystem Expansion
Support is coming for Alpine, Debian, Swift, RubyGems, Conan, and Terraform packages, enabling teams to standardize more of their software supply chain on a single platform.
Governance, Security, and Operational Control
We’re investing in artifact lifecycle management, immutability, audit logging, storage quota controls, and deeper integration with Harness Security Solutions.
AI, Visibility, and Integrations
Upcoming capabilities include semantic artifact discovery, custom dashboards, AI-powered chat, OSS gatekeeper agents, and deeper integration with Harness Internal Developer Portal.
Modern software delivery demands clear control over how software is built, secured, and distributed. As supply chain threats increase and delivery velocity accelerates, organizations need earlier visibility and enforcement without introducing new friction or operational complexity.
We invite you to sign up for a demo and see firsthand how Harness Artifact Registry delivers high-performance artifact distribution with built-in security and governance at scale.
API Failure: 7 Causes and How to Fix Them
What Is an API Failure?
An API failure is any response that doesn’t conform to the system’s expected behavior being invoked by the client. One example is when a client makes a request to an API that is supposed to return a list of users but returns an empty list (i.e., {}). A successful response must have a status code in the 200 series. An unsuccessful response must have either an HTTP error code or a 0 return value.
What Are the Common API Error Codes?
An API will raise an exception if it can’t process a client request correctly. The following are the common error codes and their meanings:
- 400 Bad Request: This error occurs when the client request is malformed or cannot be processed by your API.
- 401 Unauthorized: This error occurs when an API key is missing or incorrectly entered.
- 403 Forbidden: This error occurs when a user tries to access a resource they don’t have permission to see.
- 404 Not Found: This error, also known as a File Not Found error, rarely has anything to do with the API itself but instead with the underlying system (for example, if trying to access a file that doesn’t exist on the server). This is usually related to something else and not directly related to your API code.
- 500 Internal Server: This error occurs when your server can’t respond to a request from a user or can’t find some data (for example, you’re trying to access any post, but none of the posts exist for the given ID).
What Causes API Failure?
An API failure can happen because of issues with the endpoints like network connectivity, latency, and load balancing issues. The examples below may give you a good understanding of what causes an API failure.
1. Incorrect API Permissions
Some APIs are better left locked down to those who need access and are only available to those using an approved key. However, when you don’t set up the correct permissions for users, you can impede the application’s basic functionality. If you’re using an external API, like Facebook, Twitter, or even Google Analytics, make sure you’re adding the permissions for your users to access the data they need. Also, keep on top of any newly added features that can increase security risks.
How to Fix Incorrect API Permissions
If you’re leveraging external APIs requiring extra configuration, get the correct API key so the app has the proper permissions. Also, provide your clients with API keys relevant to their authorization levels. Thus, your users will have the correct permissions and will seamlessly access your application.
2. Unsecured Endpoints and Data Access Tokens
We’ve all seen it happen a million times: someone discovers an API that’s exposed to everyone after gaining user consent. Until now, this was usually reasonably benign, but when credentials are leaked, things can get ugly fast, and companies lose brand trust. The biggest problem here is keeping admins from having unsecured access to sensitive data.
How to Fix Unsecured Endpoints and Data Access Tokens
Using a secure key management system that includes the “View Keys” permission for the account will help mitigate this risk. For example, you could use AWS Key Management Service (AWS KMS) to help you manage and create your encryption keys. If you can’t protect your keys, then at the very least, include a strong master password that all users can access, and only give out these keys when needed.
3. Invalid Session Management
Untrusted tokens and session variables can cause problems for how a website functions, causing timing issues with page loads and login calls or even creating a denial of service, which can harm the end-user experience and your brand.
How to Fix Invalid Session Management
The best way to secure sensitive data is by using token authentication, which will encode user data into the token itself based on time/date stamps. You can then enforce this to ensure that whenever you reissue tokens, they expire after a set amount of time or use them for API requests only. As for session variables, these are usually created based on your authentication keys and should be handled the same way as your privileged keys—with some encryption. And keep the source of your keys out of the hands of anyone who can access them.
4. Expiring APIs
If you’re using an API to power a website, you must upload new data in real time or save it to a cache for later use. When you set an expiry time for an API and fail to update, you make it unavailable. When a user or application tries to access it after the expiry, they get a 404 or 500 error.
How to Fix Expiring APIs
You should use a middle ground option—a proxy API. This will allow you to cache your data before you make it available and only allow access to the correct bits of the APIs as needed. You should also schedule tasks that run daily to import updated data and bring it into your system.
5. Bad URLs
This one isn’t necessarily a mistake, but it happens from time to time when developers aren’t careful about how they name things or if they’re using an improper URL structure for their API endpoints. When the URL structure is too complex or has invalid characters, you will get errors and failures. Look at some examples of bad URL structure: “http://example.com/api/v1?mode=get” The above structure is bad because the "?" character filters a single parameter, not the type of request. The default request type is GET; thus, a better URL would look like this: “http://example.com/api/v1”
How to Fix Bad URLs
Remove any unsafe characters in your URL, like angle brackets (<>). You use angle brackets as delimiters in your URL. Also, design the API to make it more friendly for users. For example, this URL "https://example.com/users/name" tells users they’re querying the names of users, unlike this URL "https://example.com/usr/nm" It’s also good practice to use a space after the “?” in your API URL because otherwise, people can mistakenly think that the space is part of a query string.
6. Overly Complex API Endpoints
This happens when trying to build multiple ways of accessing multiple applications. You do this by relying on generic endpoints instead of target audiences and specific applications. Creating a lot of different paths for the same data results in non-intuitive routes.
How to Fix Overly Complex API Endpoints
There are several ways to go about this, but for most, you want to use a network proxy system that can handle the different data access methods and bring it all into one spot. This will help minimize potential issues with your APIs routes and help with user confusion and brand damage.
7. Exposed APIs on IPs
This can happen when organizations are not properly securing their public IP addresses, or there is no solid monitoring process. This exposes your assets by providing easy access to anyone. Exposed IPs make your application vulnerable to DDoS attacks and other forms of abuse or phishing.
How to Fix Exposed APIs on IPs
Make sure you properly manage your IP addresses and have a solid monitoring system. You must block all IPv6 traffic and enforce strict firewall rules on your network. You should only allow service access through secure transport methods like TLS.
Conclusion
API errors are a plague on the internet. Sometimes they come as very poor performance that can produce long response times and bring down APIs, or they can be network-related and cause unavailable services. They’re often caused by problems such as inconsistent resource access errors, neglect in proper authentication checks, faulty authentication data validation on endpoints, failure to read return codes from an endpoint, etc. Once organizations recognize what causes API failures and how to mitigate them, they seek web application and API protection (WAAP) platforms to address the security gaps. Harness WAAP by Traceable helps you analyze and protect your application from risk and thus prevent failures.
About Traceable
Harness WAAP is the industry’s leading API security platform that identifies APIs, evaluates API risk posture, stops API attacks, and provides deep analytics for threat hunting and forensic research. With visual depictions of API paths at the core of its technology, its platform applies the power of distributed tracing and machine learning models for API security across the entire software development lifecycle. Book a demo today.

Argo CD Install: Helm-Based Setup for Enterprise DevOps Teams
What You’re Installing (and Why Enterprises Standardize on Argo CD)
Argo CD is a Kubernetes-native continuous delivery controller that follows GitOps principles: Git is the source of truth, and Argo CD continuously reconciles what’s running in your cluster with what’s declared in Git.
That pull-based reconciliation loop is the real shift. Instead of pipelines pushing manifests into clusters, Argo CD runs inside the cluster and pulls the desired state from Git (or Helm registries) and syncs it to the cluster. The result is an auditable deployment model where drift is visible and rollbacks are often as simple as reverting a Git commit.
For enterprise teams, Argo CD becomes a shared platform infrastructure. And that changes what “install” means. Once Argo CD is a shared control plane, availability, access control, and upgrade safety matter as much as basic deployment correctness because failures impact every team relying on GitOps.
What It Means In An Enterprise
A basic install is “pods are running.” An enterprise install is:
- Secure access (SSO + least-privilege RBAC)
- Safe multi-team usage (AppProjects guardrails, predictable onboarding)
- Stable operations (monitoring, backups, upgrades)
- Repeatability (version pinning, Git-driven configuration)
Argo CD can be installed in two ways: as a “core” (headless) install for cluster admins who don’t need the UI/API server, or as a multi-tenant install, which is common for platform teams. Multi-tenant is the default for most enterprise DevOps teams that use GitOps with a lot of teams.
Setup Prerequisites
Before you start your Argo CD install, make sure the basics are in place. You can brute-force a proof of concept with broad permissions and port-forwarding. But if you’re building a shared service, doing a bit of prep up front saves weeks of rework.
Cluster Prerequisites
- A Kubernetes cluster you can administer (or at least create namespaces and cluster-scoped resources).
- Network path to the API server from your workstation/CI environment.
- A plan for ingress and TLS (internal-only is fine, just decide early).
Workstation Tools
- kubectl configured for the target cluster
- helm (recommended approach)
- Optional: argocd CLI (useful for scripting and verification)
Platform Prerequisites to Confirm
- Ingress controller availability (NGINX, ALB Ingress Controller, Traefik, etc.), or a willingness to use a cloud LoadBalancer.
- DNS for a stable Argo CD hostname (even if internal).
- Certificate strategy for TLS (cert-manager, corporate PKI, or managed certs).
If your team is in a regulated environment, align on these early:
- Where Argo CD secrets will live (Kubernetes Secrets vs external secrets tooling)
- Audit requirements (SSO provider logs, Kubernetes audit logs, etc.)
- Network restrictions (private clusters, egress policies)
Decide Your Argo CD Installation Approach
Argo CD install choices aren’t about “works vs doesn’t work.” They’re about how you want to operate Argo CD a year from now.
Helm vs. Upstream Manifests
Helm (recommended for enterprise):
- Repeatable installs across environments (dev/stage/prod)
- Easy upgrades via version pinning
- Values-driven configuration you can store in Git
Upstream manifests:
- Fast and close to upstream defaults
- Great for evaluation or a quick validation environment
- Less structured change management unless you wrap it in GitOps
If your Argo CD instance is shared across teams, Helm usually wins because version pinning, values-driven configuration, and repeatable upgrades are easier to audit, roll back, and operate safely over time.
Single Instance vs. Multiple Instances
Enterprises often land in one of these models:
- One shared Argo CD instance per cluster (common in platform teams)
- One shared instance managing multiple clusters (central GitOps control plane)
- Multiple instances (per business unit or compliance boundary)
As a rule: start with one shared instance and use guardrails (RBAC + AppProjects) to keep teams apart. Add instances only when you really need to (for example, because of regulatory separation, disconnected environments, or blast-radius requirements).
When Argo CD is a shared dependency, high availability (HA) is important. If teams depend on Argo CD to deploy, having just one replica Argo CD server can slow things down and cause problems with pagers.
How You’ll Expose Argo CD
There are three common access patterns:
- Port-forward (setup only): safest for a first login, not an enterprise default.
- Ingress (most common): use your standard ingress + TLS termination.
- LoadBalancer service: simple in cloud environments, but can increase cost and widen exposure.
For most enterprise teams, the sweet spot is Ingress + TLS + SSO, with internal-only access unless your operating model demands external access.
Install Argo CD Using Helm (Step-by-Step)
If you’re building Argo CD as a shared service, Helm gives you the cleanest path to versioned, repeatable installs.
Step 1: Add the Helm Repo and Pin a Version
helm repo add argo https://argoproj.github.io/argo-helm
helm repo update
# Optional: list available versions so you can pin one
helm search repo argo/argo-cd --versions | head -n 10
In enterprise environments, “latest” isn’t a strategy. Pin a chart version so you can reproduce your install and upgrade intentionally.
Step 2: Create the argocd Namespace
kubectl create namespace argocd
Keeping Argo CD isolated in its own namespace simplifies RBAC, backup scope, and day-2 operations.
Step 3: Export Default Values and Make Minimal Enterprise Edits
Start by pulling the chart’s defaults:
helm show values argo/argo-cd > values.yaml
Then make the minimum changes needed to match your access model. Many tutorials demonstrate NodePort because it’s easy, but most enterprises should standardize on Ingress + TLS.
Here’s a practical starting point (adjust hostnames, ingress class, and TLS secret to match your environment):
# values.yaml (example starter)
global:
domain: argocd.example.internal
configs:
params:
# Common when TLS is terminated at an ingress or load balancer.
server.insecure: "true"
server:
ingress:
enabled: true
ingressClassName: nginx
hosts:
- argocd.example.internal
tls:
- secretName: argocd-tls
hosts:
- argocd.example.internal
# Baseline resource requests to reduce noisy-neighbor issues.
controller:
resources:
requests:
cpu: 200m
memory: 512Mi
repoServer:
resources:
requests:
cpu: 200m
memory: 512Mi
This example focuses on access configuration and baseline resource isolation. In most enterprise environments, teams also explicitly manage RBAC policies, NetworkPolicies, and Redis high-availability decisions as part of the Argo CD platform configuration.
If your clusters can’t pull from public registries, you’ll need to mirror Argo CD and dependency images (Argo CD, Dex, Redis) into an internal registry and override chart values accordingly.
Step 4: Install (Or Upgrade) Argo CD
Use helm upgrade --install so your install and upgrade command is consistent.
helm upgrade --install argocd argo/argo-cd \
--namespace argocd \
--values values.yaml
Validate that core components are healthy:
kubectl get pods -n argocd
kubectl get svc -n argocd
kubectl get ingress -n argocd
If something is stuck, look at events:
kubectl get events -n argocd --sort-by=.lastTimestamp | tail -n 30
Step 5: Confirm the Installation Shape (What’s Running)
Most installs include these core components:
- argocd-server (UI/API)
- argocd-repo-server (fetches repos and renders manifests)
- argocd-application-controller (reconciliation)
- ApplicationSet Controller (optional but common at scale)
- Dex (if enabled for SSO integration)
- Redis (caching and coordination)
Knowing what each component does helps you troubleshoot quickly when teams start scaling usage.
Access the Argo CD UI and First Login
Your goal is to get a clean first login and then move toward enterprise access (Ingress + TLS + SSO).
Option 1: Port-Forward (Best for Initial Setup)
kubectl port-forward -n argocd svc/argocd-server 8080:443
Then open https://localhost:8080.
It’s common to see an SSL warning because Argo CD ships with a self-signed cert by default. For a quick validation, proceed. For enterprise usage, use real TLS via your ingress/load balancer.
Option 2: Ingress (Enterprise Default)
Once DNS and TLS are wired:
- Browse to https://argocd.example.internal
- Confirm you’re hitting the ingress you expect (and that TLS is correct)
If your ingress terminates TLS at the edge, running the Argo CD API server with TLS disabled behind it (for example, server.insecure: “true”) is a common pattern.
Get the Initial Admin Password
Default username is typically admin. Retrieve the password from the initial secret:
kubectl -n argocd get secret argocd-initial-admin-secret \
-o jsonpath="{.data.password}" | base64 --decode; echo
After you’ve logged in and set a real admin strategy using SSO and RBAC, the initial admin account should be treated as a break-glass mechanism only. Disable or tightly control its use, rotate credentials, and document when and how it is allowed.
Install Argo CD Using Upstream Manifests (Fast Path for Evaluation)
If you want a quick Argo CD install for learning or validation, upstream manifests get you there fast.
Important context: the standard install.yaml manifest is designed for same-cluster deployments and includes cluster-level privileges. It’s also the non-HA install type that’s typically used for evaluation, not production. If you need a more locked-down footprint, Argo CD also provides namespace-scoped and HA manifest options in the upstream manifests.
kubectl create namespace argocd
kubectl apply -n argocd -f https://raw.githubusercontent.com/argoproj/argo-cd/stable/manifests/install.yaml
Validate:
kubectl get pods -n argocd
kubectl get svc -n argocd
Then port-forward to access the UI:
kubectl port-forward -n argocd svc/argocd-server 8080:443
Use admin plus the password from argocd-initial-admin-secret as shown in the prior section.
For enterprise rollouts, treat manifest installs as a starting point. If you’re standardizing Argo CD across environments, Helm is easier to control and upgrade.
Deploy Your First Application With Argo CD
A real install isn’t “pods are running.” A real install is “we can deploy from Git safely.” This quick validation proves:
- repo access works
- sync works
- drift shows up
- rollbacks are Git-driven
Step 1: Pick a Simple Repo Layout
Keep it boring and repeatable. For example:
apps/
guestbook/
base/
overlays/
dev/
prod/
Or, if you deploy with Helm:
apps/
my-service/
chart/
values/
dev.yaml
prod.yaml
Step 2: Create an AppProject (The Enterprise Guardrail)
Even for a test app, start with the guardrail. AppProjects define what a team is allowed to deploy, and where.
apiVersion: argoproj.io/v1alpha1
kind: AppProject
metadata:
name: team-sandbox
namespace: argocd
spec:
description: "Sandbox boundary for initial validation"
sourceRepos:
- "https://github.com/argoproj/argocd-example-apps.git"
destinations:
- namespace: sandbox
server: https://kubernetes.default.svc
namespaceResourceWhitelist:
- group: "apps"
kind: Deployment
- group: ""
kind: Service
- group: "networking.k8s.io"
kind: Ingress
Apply it:
kubectl apply -f appproject-sandbox.yaml
Step 3: Create an Application and Sync
apiVersion: argoproj.io/v1alpha1
kind: Application
metadata:
name: guestbook
namespace: argocd
spec:
project: team-sandbox
source:
repoURL: https://github.com/argoproj/argocd-example-apps.git
targetRevision: HEAD
path: guestbook
destination:
server: https://kubernetes.default.svc
namespace: sandbox
syncPolicy:
automated:
selfHeal: true
prune: false
syncOptions:
- CreateNamespace=true
Note: In many enterprise environments, namespace creation is restricted to platform workflows or Infrastructure as Code pipelines. If that applies to your organization, remove CreateNamespace=true and require namespaces to be provisioned separately.
Apply it:
kubectl apply -f application-guestbook.yaml
Now confirm:
- The app shows up in the UI
- It syncs successfully
- If you change something manually in-cluster, the app becomes OutOfSync
- If you revert Git, syncing takes you back to the previous state
Optional: Add Git Webhooks for Faster Sync
By default, Argo CD polls repos periodically. Many teams configure webhooks (GitHub/GitLab) so Argo CD can refresh and sync quickly when changes land. It’s not required for day one, but it improves feedback loops in active repos.
Secure Access and Multi-Team Guardrails
This is where most enterprise rollouts either earn trust or lose it. If teams don’t trust the platform, they won’t onboard their workloads.
Focus on these enterprise minimums:
- SSO first: your identity provider should be the source of truth.
- Least privilege: app teams deploy only to approved namespaces/clusters.
- Guardrails as code: AppProjects prevent accidental cross-team deploys.
Practical rollout order:
- Establish a stable hostname (so SSO callbacks are consistent).
- Configure SSO (OIDC or SAML) and group mapping.
- Apply RBAC aligned to roles (platform admin, app owner, read-only).
- Define AppProjects for team boundaries.
Break-glass access should exist, but it should be documented, auditable, and rare.
Production Hardening and Day-2 Operations
Enterprise teams don’t struggle because they can’t install Argo CD. They struggle because Argo CD becomes a shared dependency—and shared dependencies need operational maturity.
High Availability and Scaling
At scale, pressure points are predictable:
- argocd-server: UI/API and auth flows
- repo-server: Git/Helm fetches, rendering, and caching
- application-controller: reconciliation across many apps/clusters
Plan a path to HA before you onboard many teams. If HA Redis is part of your design, validate node capacity so workloads can spread across failure domains.
Monitoring and Alerting
Keep monitoring simple and useful:
- Argo CD API availability
- sync failure rate
- number of degraded apps
- reconciliation lag (are apps taking too long to converge?)
Also, decide alert ownership and escalation paths early. Platform teams typically own Argo CD availability and control-plane health, while application teams own application-level sync and runtime issues within their defined boundaries.
- Platform team owns Argo CD availability.
- App teams own app-level health within their boundary.
Backups, Restore Tests, and DR
Git is the source of truth for desired state, but you still need to recover platform configuration quickly.
Backup:
- argocd namespace ConfigMaps and Secrets
- Argo CD custom resources (Applications, AppProjects, ApplicationSets)
Then run restore tests on a schedule. The goal isn’t perfection—it’s proving you can regain GitOps control safely.
Upgrade Strategy
A safe enterprise approach:
- Pin chart/app versions and document what’s running.
- Stage upgrades in a non-production environment.
- Validate core workflows after upgrade (login, repo access, sync).
- Promote the same change through environments.
Avoid “random upgrades.” Treat Argo CD as platform infrastructure with controlled change management.
Argo CD Install on EKS: Enterprise Notes
Argo CD works well on EKS, but enterprise teams often have extra constraints: private clusters, restricted egress, and standard AWS ingress patterns.
Common installation approaches on EKS:
- Manual install (Helm/manifests): direct control; easiest if you already have platform standards.
- Terraform: repeatable infrastructure and bootstrap.
- EKS Blueprints: a structured AWS-aligned framework for adding platform components.
For access, most EKS enterprise teams standardize on an ingress backed by AWS Load Balancer Controller (ALB) or NGINX, with TLS termination at the edge.
Making Argo CD Production-Ready
An enterprise-grade Argo CD install is less about getting a UI running and more about putting the right foundations in place: a repeatable deployment method (typically Helm), a stable endpoint for access and SSO, and clear boundaries so teams can move fast without stepping on each other. If you take away one thing, make it this: treat Argo CD like shared platform infrastructure, not a one-off tool.
Start with a pinned, values-driven Helm install. Then lock in the enterprise minimums: SSO, RBAC, and AppProjects, before you onboard your second team. Finally, operationalize it with monitoring, backups, and a staged upgrade process so Argo CD stays reliable as your cluster and application footprint grows.
When you need orchestration, approvals, and progressive delivery across complex releases, pair GitOps with Harness CD. Request a demo.
Argo CD Installation: Frequently Asked Questions (FAQs)
These are quick answers to the most common questions that business teams have when they install Argo CD.
What’s the best way to install Argo CD for production?
Most enterprise teams should use Helm to install Argo CD because it lets you pin versions, keep configuration in Git, and upgrade in a predictable way. Upstream manifests are a great way to get started quickly if you’re thinking about Argo CD.
How can we safely expose Argo CD?
Use an internal hostname, end TLS at your ingress/load balancer, and make sure that SSO is required for interactive access. Do not make Argo CD public unless your business model really needs it.
What is the safest way to upgrade Argo CD?
Pin your chart/app versions, test upgrades in a non-production environment, and then move the same change to other environments. After the upgrade, check that you can log in, access the repo, and sync with a real app.
What’s the right model for multi-team access?
Use RBAC and AppProjects to set limits on a single shared instance. Only approved repos should be used by app teams to deploy to approved namespaces and clusters.
How do we back up and restore Argo CD?
Back up the argocd namespace (ConfigMaps, Secrets, and CRs) and keep app definitions in Git. Run restore tests on a schedule so recovery steps are proven, not theoretical.

Harness Artifact Registry: Your Unified OCI-Compliant Gateway for Secure Artifact Management
If you've worked with builds and deployments, then you already know how central Docker images, dependencies, and containers are to modern software delivery. The introduction of Docker revolutionised how we package and run software, while the Open Container Initiative (OCI) brought much-needed standardisation to container formats and distribution. Docker made containers mainstream; OCI made them universal.
Even though Docker Hub and private registries have served us well, they often introduce challenges at scale:
- Limited governance and control — OCI defines standards, but managing how standardised images are used, updated, and secured across environments is often left to manual processes.
- Security at the edge instead of by design — vulnerability scans and policy checks typically happen after the fact, leaving pipelines exposed to build failures or compromised dependencies.
- Exposure to supply chain risks — even perfectly built artifacts can fall victim to typosquatting or malicious dependency injection, quietly introducing malware into trusted environments.
And even after every dependency and sanity check passes, one question remains:
How effectively can you integrate and deploy artifacts through your CI/CD supply chain, without risking credential leaks or losing end-to-end visibility?
The Problems Are Clear — So Is the Solution
This is exactly where Harness Artifact Registry comes in.
Harness Artifact Registry is a cloud-native, secure artifact storage and management platform built for the future. Unlike traditional Docker registries or basic container registries, it's designed not just to store your Docker images and artifacts but also to actively secure and govern them. It's fully OCI-compliant, supporting Docker containers and other container formats natively, whilst integrating directly with CI/CD pipelines, policy engines, and vulnerability scanners.
Let me walk you through the complete journey of how an artifact moves through Harness Artifact Registry, from the moment you build it to when it's deployed in production.
The OCI-Compliant Artifact Journey
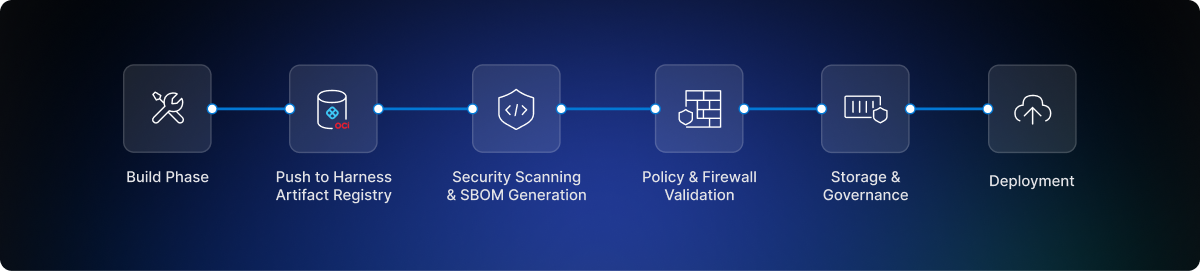
Docker Registry Client Setup
It all begins with the very first step after you build your Docker image on your system: storing it in a secure artifact storage layer through your container registry. Harness Artifact Registry supports more than 16 registry types and is fully OCI-compliant. You can simply use Docker to push the artifacts into the registry or even use the Harness CLI for it.
It is as simple as pushing to Docker Hub. Once you've authenticated with your Harness Artifact Registry, you can use standard Docker commands to push Docker images:
# Step 1: Tag the existing image (using its digest) with a new tag
docker tag <REGISTRY_URL>/<REPOSITORY>/<IMAGE_NAME>@<DIGEST> <REGISTRY_URL>/<REPOSITORY>/<IMAGE_NAME>:<NEW_TAG>
# Step 2: Push the newly tagged image to the registry
docker push <REGISTRY_URL>/<REPOSITORY>/<IMAGE_NAME>:<NEW_TAG>
Because Harness Artifact Registry is fully OCI-compliant, it works seamlessly with any OCI-compatible client. This means you don't need to learn new tools or change your existing Docker workflows. Whether you're migrating from Google Artifact Registry, Azure Container Registry, AWS ECR, or Docker Hub, the experience remains consistent.
Pulling from External Resources
We understand that a build requires many dependencies and versioning, with some even pulling from open-source repositories. These sources can vary significantly for enterprises. That's why we've made it easy to integrate custom registries so you can cache artifacts via a proxy.
Harness Artifact Registry allows you to configure upstream registries as remote repositories. This means you can:
- Cache dependencies locally to reduce external network calls and improve build times
- Control access to external Docker registries and artifact repositories through a single point of entry
- Scan external artifacts before they enter your environment
Apart from Docker Hub, Google Artifact Registry, and AWS ECR, you can set up custom registries with just a Remote Registry URL and basic authentication using a username and password. This proxy capability ensures that even when your teams pull Docker images from public registries, everything flows through Harness Artifact Registry first, giving you complete visibility, governance, and unified artifact storage control.
Security by Design
This is where Harness Artifact Registry truly shines. Rather than treating security as an afterthought, it's baked into every layer of the artifact lifecycle.
Built-in Container Scanners
Container vulnerability scanners detect security issues in your Docker images and container images before they can cause problems. Harness Artifact Registry integrates with industry-leading scanners like Aqua Trivy and Snyk, allowing you to automatically scan every artifact that enters your registry.
Here's what makes this powerful: when a Docker image is pushed, Harness automatically triggers a security pipeline that scans the artifact and generates a complete Software Bill of Materials (SBOM) along with detailed vulnerability reports. You get immediate visibility into:
- Known CVEs (Common Vulnerabilities and Exposures) with severity ratings
- All packages and libraries included in the Docker image
- Outdated dependencies and their versions
- Licence compliance issues
- Configuration vulnerabilities
The SBOM and vulnerability details are displayed directly in the Harness interface, giving you complete transparency into what's inside your containers and their security posture. This level of container security goes beyond what traditional Docker registries offer.
Dependency Firewall
When you're pulling dependencies from external sources through the upstream proxy, the Dependency Firewall actively blocks risky or unapproved packages before they even enter your registry. You can configure it to either block suspicious dependencies outright or set it to warn mode for your team to review. This means malicious dependencies are stopped at the gate, not discovered later in your pipeline.
Policy Sets
Beyond vulnerability scanning, you can assign policy sets to be evaluated against each artifact. These policies act as automated gatekeepers, enforcing your organisation's security and compliance requirements.
For example, you might create policies that:
- Block Docker images with critical vulnerabilities from being deployed
- Require all container images to be signed
- Enforce naming conventions for artifacts
- Mandate specific base images for Docker containers
Policies are evaluated automatically, and non-compliant artifacts can be quarantined or blocked entirely.
Quarantine
When an artifact fails a security scan or violates a policy, it can be automatically quarantined. This prevents it from being used in deployments whilst still allowing your team to investigate and remediate the issues. This proactive approach significantly reduces your attack surface and ensures only verified artifacts make it to production.
Integrating with Harness CI/CD Pipelines
Your artifact is now ready, fully scanned for vulnerabilities, and stored securely in your container registry. This is where everything comes together for developers and platform engineers alike. The seamless integration between Harness Artifact Registry and Harness CI/CD pipelines means you can build Docker images, store artifacts, and deploy without context switching or managing complex credentials across multiple registry systems.
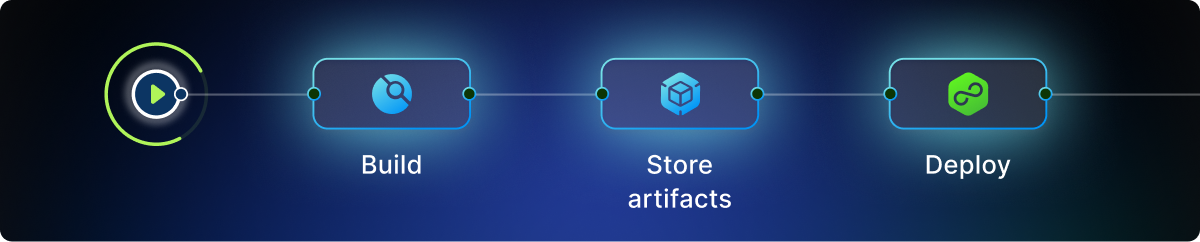
Building and Publishing with Harness CI
Harness CI is all about getting your code built, tested, and packaged efficiently. Harness Artifact Registry fits naturally into this workflow by providing native steps that eliminate the complexity of managing Docker registry credentials and connections.
Build and Push to Docker: This native CI step allows you to build your Docker images and push them directly to Harness Artifact Registry without any external connectors. The platform handles Docker registry authentication automatically, so you can focus on your build logic rather than credential management.
Upload artifacts: Beyond Docker images, you can publish Maven artifacts, npm packages, Helm charts, or generic files directly to Harness Artifact Registry. This unified artifact management approach means all your build outputs live in one place, with consistent vulnerability scanning and policy enforcement across every artifact type.
The essence here is simplicity: your CI pipeline produces artifacts and Docker containers, and they're automatically stored, scanned, and made available for deployment, all within the same platform.
Deploying with Harness CD
Every deployment needs an artifact. Whether you're deploying Docker containers to Kubernetes, AWS ECS, Google Cloud Run, or traditional VMs, your deployment pipeline needs to know which version of your application to deploy and where to get it from.
This is where Harness Artifact Registry becomes invaluable. Because it's natively integrated with Harness CD, your deployment pipelines can pull Docker images and artifacts directly without managing external Docker registry credentials or complex authentication flows.
Harness CD supports numerous deployment types (often called CD swimlanes), and Harness Artifact Registry works seamlessly with all of them. When you configure a CD service, you simply select Harness Artifact Registry as your artifact source, specify which container registry and artifact to use, and define your version selection criteria.
From there, the deployment pipeline handles everything: authenticating with the registry, pulling the correct Docker image version, verifying it's passed vulnerability scans and security checks, and deploying it to your target environment. You can deploy to production with strict version pinning for stability, or to non-production environments with dynamic version selection for testing. The choice is yours, and it's all configured through the same intuitive interface.
The real power lies in the traceability. Every deployment is logged with complete details: which artifact version was deployed, when, by whom, and to which environment. If you need to roll back, the previous Docker image versions are right there, ready to be redeployed.
Why This Matters
From the moment you build a Docker image to when it's running in production, Harness Artifact Registry provides a complete, secure, and governed artifact lifecycle. You get container security that prevents issues before they occur, complete visibility through SBOM generation and audit logs, and native CI/CD integration that eliminates the complexity of managing multiple Docker registries and credentials.
This isn't just about storing Docker images. It's about building confidence in your software supply chain with a secure, OCI-compliant container registry.
In a world where supply chain attacks are increasingly common and compliance requirements continue to grow, having a robust artifact management and container registry strategy is essential. Harness Artifact Registry delivers that strategy through a platform that's both powerful and intuitive.
Whether you're a developer pushing your first Docker image, a platform engineer managing deployment pipelines, or a security professional ensuring compliance, Harness Artifact Registry provides the tools you need to move fast without compromising on security.
Ready to experience a fully OCI-compliant Docker registry with built-in vulnerability scanning, dependency firewall, and seamless CI/CD integration? Explore Harness Artifact Registry and see how it transforms your software delivery pipeline with secure artifact management.

Database Governance with OPA in Harness DB DevOps
Database systems store some of the most sensitive data of an organization such as PII, financial records, and intellectual property, making strong database governance non-negotiable. As regulations tighten and audit expectations increase, teams need governance that scales without slowing delivery.
Harness Database DevOps addresses this by applying policy-driven governance using Open Policy Agent (OPA). With OPA policies embedded directly into database pipelines, teams can automatically enforce rules, capture audit trails, and stay aligned with compliance requirements. This blog outlines how to use OPA in Harness to turn database compliance from a manual checkpoint into a built-in, scalable part of your DevOps workflow.
The Challenges of Database Compliance
Organizations face multiple challenges when navigating database compliance:
- Complex Regulatory Requirements: Standards such as GDPR, HIPAA, PCI-DSS, and SOX impose strict controls on data access, consent, storage, and processing. Compliance requires both preventative controls (e.g., access restrictions) and demonstrable evidence of effective enforcement.
- Lack of Visibility: Traditional database operations often lack centralized oversight, making it difficult to answer questions like “Who accessed data?”, “Which change was deployed?” or “Were controls enforced consistently?” without expensive, manual processes.
- Manual Processes and Human Error: Manual access approvals, change reviews, or ad-hoc scripting introduce risks, from privilege creep to inconsistent documentation that can lead to compliance gaps.
These challenges highlight the necessity of embedding governance directly into database development and deployment pipelines, rather than treating compliance as a reactive checklist.
Governance at Scale with Harness Database DevOps
Harness Database DevOps is designed to offer a comprehensive solution to database governance - one that aligns automation with compliance needs. It enables teams to adopt policy-driven controls on database change workflows by integrating the Open Policy Agent (OPA) engine into the core of database DevOps practices.
What is OPA and Policy as Code?
Open Policy Agent (OPA) is an open-source, general-purpose policy engine that decouples policy decisions from enforcement logic, enabling centralized governance across infrastructures and workflows. Policies in OPA are written in the Rego declarative language, allowing precise expression of rules governing actions, access, and configurations.
Harness implements Policy as Code through OPA, enabling teams to store, test, and enforce governance rules directly within the database DevOps lifecycle. This model ensures that compliance controls are consistent, auditable, and automatically evaluated before changes reach production.
Building a Governance Framework Using OPA Policies
Here’s a structured approach to implementing database governance with OPA in Harness:
1. Define Compliance and Governance Objectives
Start by cataloging your regulatory obligations and internal governance policies. Examples include:
- Restricting access to sensitive tables based on roles or departments.
- Prohibiting destructive schema changes (e.g., DROP TABLE) in production.
- Enforcing least privilege by limiting modify rights only to authorized service accounts.
- Requiring reviews and approvals for schema migrations above a threshold.
Translate these requirements into quantifiable rules that can be expressed in Rego.
2. Author OPA Policies in Harness
Within the Harness Policy Editor, define OPA policies that codify governance rules. For example, a policy might block any migrations containing operations that remove columns in production environments without explicit DBA approval.
Harness policies are modular and reusable, you can import and extend them as part of broader governance packages. This allows cross-team reuse and centralized management of rules. Key aspects include:
- Policy Modules: Group related rules into packages for clarity.
- Policy Severity: Optionally set enforcement thresholds (e.g., error vs. warning).
- Testing and Simulation: Harness provides testing tools to validate policies against real or sample inputs before activation.
By expressing governance as code, you ensure consistency and remove ambiguity in policy enforcement.
3. Integrate Policies with CI/CD Pipelines
Policies can be linked to specific triggers within your database deployment workflow, for instance, evaluating rules before a migration is applied or before a pipeline advances to production. This integration ensures that non-compliant changes are automatically blocked, while compliant changes proceed seamlessly, maintaining the balance between speed and control.
Operationalizing Database Compliance
Automated Enforcement
Harness evaluates OPA policies at defined decision points in your pipeline, such as pre-deployment checks. This prevents risky actions, enforces access controls, and aligns every deployment with governance objectives without manual intervention.
Audit Trails and Traceability
Every policy evaluation is logged, creating an auditable trail of who changed what, when, and why. These logs serve as critical evidence during compliance audits or internal reviews, reducing the overhead and risk associated with traditional documentation practices.
Role-Based Controls and Least Privilege
By enforcing the principle of least privilege, policies ensure that users and applications possess only the necessary permissions for their specific roles. This restriction on access is crucial for minimizing the potential attack surface and maintaining compliance with regulatory requirements for data access governance.
Best Practices for Policy-Driven Governance
- Start with High-Impact Policies: Prioritize controls around sensitive data and production environments.
- Leverage Policy Libraries: Use reusable policy templates as a starting point and customize them for your organizational context.
- Iterate with Continuous Feedback: Use audit results and pipeline failures as feedback loops to refine policies.
- Align with Compliance Frameworks: Map OPA policies to specific regulatory requirements (e.g., GDPR’s principle of accountability) to demonstrate traceability during audits.
- Educate Teams: Ensure developers and DBAs understand the governance policies and the reasons behind them to reduce friction.
Conclusion
Database governance is an essential pillar of enterprise compliance strategies. By embedding OPA-based policy enforcement within Harness Database DevOps, organizations can automate compliance controls, minimize risk, and maintain developer productivity. Policy as Code provides a scalable, auditable, and consistent framework that aligns with both regulatory obligations and the need for agile delivery.
Transforming database governance from a manual compliance burden into an automated, integrated practice empowers teams to innovate securely, confidently, and at scale - ensuring that every change respects the policies that protect your data, your customers, and your brand.

Measuring Developer Productivity: Prove Impact
Your developer productivity initiative didn't collapse because the data was wrong. It stalled because it couldn't answer the business question.
Leadership asked, "So what?"
You presented improved cycle time, higher deployment frequency, lower change failure rate. The dashboards were polished and the trends were moving in the right direction. And still, the room was unconvinced, because the real question was never about operational motion. It was whether engineering was driving measurable business impact.
The best engineering organizations stopped treating productivity as an internal reporting exercise a long time ago. They don't measure to validate effort. They measure to demonstrate outcomes, treating productivity as a strategic capability rather than a compliance artifact. That framing shift is the difference between a dashboard that gets ignored and a measurement system that actually influences investment decisions.
Developer Productivity Metrics That Actually Mean Something
Most engineering productivity programs fail at the measurement selection stage. Teams track what is easy to instrument instead of what influences strategic outcomes: lines of code shipped, tickets closed, pull requests merged. These are activity signals. They describe motion, not value creation.
Even widely respected metrics become vanity indicators when stripped of context. Deployment frequency sounds impressive until you ask what those deployments actually delivered. Lead time looks strong until you realize the shipped features didn't move adoption or revenue. Change failure rate improves, but customer experience stays flat. The numbers go up and the business question remains unanswered.
What's needed is a translation layer between technical execution and business impact. This doesn't mean abandoning quantitative rigor. It means recognizing that metrics only matter when they're connected to outcomes. Deployment frequency is not the goal; sustainable value delivery is. Lead time is not the strategy; responsiveness to market demand is. The difference is subtle, but it's decisive.
High-performing teams measure how engineering execution influences customer value, product velocity, operational risk, and strategic alignment. They treat metrics as decision inputs, not performance theater.
Why Engineering Intelligence Fails Without Workflow Context
Data without workflow context creates false conclusions. A pull request sitting in review for three days may look like inefficiency, but the cause matters enormously. Is it architectural complexity? Reviewer overload? Cross-timezone coordination? A critical design discussion that needed to happen? Without workflow visibility, metrics flatten nuance into noise and teams start optimizing the wrong bottlenecks.
Consider two teams. One deploys ten times per week with frequent rollbacks. Another deploys five times per week with zero incidents. Raw deployment frequency rewards the first team. Risk-adjusted delivery performance favors the second. Without context, your metrics are quietly incentivizing the wrong behavior, rewarding operational debt over operational discipline.
Developer productivity measurement at scale means connecting commits to pipelines, pipelines to releases, releases to incidents, and incidents back to customer impact. Only then can you distinguish between healthy experimentation and accumulating debt, between intentional technical debt reduction and systemic inefficiency. If review time improves but deployment frequency stays flat, you didn't accelerate delivery. You shifted the bottleneck. True engineering intelligence exposes those dynamics instead of hiding them behind aggregate scores.
Measuring Developer Productivity Across Team Boundaries
Most organizations measure productivity within team silos and then wonder why platform investments underperform. A backend team increasing throughput doesn't create value if frontend teams can't integrate efficiently. An infrastructure team reducing pipeline time doesn't accelerate delivery if governance constraints slow application releases downstream. A platform investment only matters if it compounds velocity across the teams that depend on it.
Engineering productivity is systemic. High-functioning organizations measure it that way, instrumenting handoffs between systems rather than just activity within them. They track how long work waits between functions, analyze how architectural decisions in one domain impact velocity in another, and measure whether platform capabilities are translating into application-level acceleration.
This is where productivity measurement shifts from operational reporting to strategic intelligence. The question stops being whether individual teams are busy and starts being whether the organization is aligned. Whether platform investments are landing. Whether architectural decisions are compounding velocity or quietly constraining it. Those answers don't come from point-in-time dashboards. They emerge from trend analysis across repositories, pipelines, and organizational boundaries.
When DORA Metrics and SPACE Framework Converge
DORA metrics provide a delivery health baseline: deployment frequency, lead time for changes, change failure rate, and time to restore service. Think of them as the vital signs of your software delivery operation, answering whether the delivery engine is healthy enough to support strategic execution.
But delivery health alone doesn't guarantee sustainable performance. The SPACE framework extends that baseline by capturing satisfaction, performance, activity, communication, and efficiency. It acknowledges what throughput metrics often miss: that sustainable velocity requires healthy teams, manageable cognitive load, and real alignment between effort and impact.
The warning signs are predictable once you know how to read them. High DORA scores alongside declining satisfaction is a burnout signal. Strong activity metrics with weak communication indicators point to silo formation. Efficient deployment paired with persistent incident volume suggests fragility hiding beneath a healthy-looking surface.
The most effective engineering organizations don't choose between DORA and SPACE. They integrate them. DORA confirms the delivery engine is functioning. SPACE confirms that function is sustainable and human. Together, they create a multi-dimensional view of engineering effectiveness that balances speed, quality, resilience, and team health, transforming productivity measurement from throughput tracking into something closer to strategic foresight.
Harness SEI: Engineering Intelligence with Context
Most engineering intelligence platforms prioritize visibility without context. They surface metrics but fail to connect them to workflow realities or business outcomes, and that's exactly where they fall short.
Harness SEI treats measuring developer productivity as a strategic capability. By integrating with source control systems, CI/CD pipelines, and issue tracking platforms, it creates a unified view of delivery performance across the engineering ecosystem, connecting commits to execution, execution to release, and release to reliability.
The more important distinction is what the platform doesn't do. It doesn't reduce productivity to individual surveillance or flatten team performance into leaderboard comparisons. A team showing slower cycle times because they're paying down technical debt is not underperforming. A platform team with lower deployment frequency because they're building foundational infrastructure is not failing. In isolation, those signals look negative. In context, they're strategic. Harness SEI is built to surface that context, giving engineering leaders visibility into whether platform improvements are compounding velocity, whether architectural investments are reducing friction, and whether delivery health is genuinely supporting strategic goals.
Proving Impact Instead of Measuring Motion
The best engineering organizations don't measure productivity to justify headcount. They measure it to demonstrate value creation, and that shift changes the entire conversation.
When your developer productivity measurement framework connects technical activity to strategic results, you stop defending engineering costs and start demonstrating engineering value. You show that faster deployments enabled a faster market response. That reduced change failure rates lowered operational costs. That improved cycle times allowed the team to deliver more customer value with the same resources.
The common thread across DORA, SPACE, and platforms like Harness SEI is the same principle: context matters more than raw numbers. Optimizing for faster deployments in isolation is tactical. Optimizing for sustainable, risk-adjusted, business-aligned delivery is strategic.
The next time leadership asks whether engineering is productive, you won't reach for activity charts. You'll respond with impact evidence: trend lines tied to business outcomes, insights grounded in workflow context, metrics that influence decision-making rather than just filling reporting cycles.
That is the difference between tracking productivity and understanding it. Between measuring motion and proving impact.
Explore Harness SEI or review implementation details. For teams evaluating long-term fit, review the SEI roadmap.

Database Schema Evolution: Designing for Continuous Change
There was a time when database design was an event. It happened once, early in a project, often before the first line of application code was written. Architects would gather with domain experts, sketch entities and relationships, debate normalization levels, and arrive after weeks of discussion, at what was believed to be the schema. Once approved, that schema was treated as immutable.
This mindset assumed that the future was predictable. But it rarely is. Modern database design is no longer about defining a perfect schema upfront, but about enabling safe, continuous evolution as systems and requirements change.
Database Design Is Not a One-Time Event
At the beginning, requirements are usually clear and limited. The schema reflects the system’s first understanding of the domain.
CREATE TABLE users (
	id SERIAL PRIMARY KEY,
    email VARCHAR(255) NOT NULL UNIQUE,
    created_at TIMESTAMP NOT NULL DEFAULT NOW()
);
This design is clean, minimal, and correct, for now. It models what the system knows today: users exist, they have an email, and they were created at a specific time.
At this stage, the schema feels complete, although it never is.
When Reality Adds Context
As the product matures, new questions emerge. The business wants to personalize communication. Support wants to address users by name. Marketing wants segmentation. The schema evolves, not because it was poorly designed, but because the system learned something new.
ALTER TABLE users
ADD COLUMN first_name VARCHAR(100),
ADD COLUMN last_name VARCHAR(100);
This change is small, additive, and safe. No existing behavior breaks. No data is lost. The schema now captures richer context without invalidating earlier assumptions.
This is evolutionary design in its simplest form: adapting without disruption.
Managing Database Schema Changes Without Breaking Production
As usage grows, teams discover new workflows. Users can now deactivate their accounts. Regulatory requirements demand traceability.
Instead of redefining the table, the schema evolves to support new behavior.
ALTER TABLE users
ADD COLUMN status VARCHAR(20) NOT NULL DEFAULT 'ACTIVE',
ADD COLUMN deactivated_at TIMESTAMP;
Importantly, this change preserves backward compatibility. Existing queries continue to work. New logic can gradually adopt the new fields. This approach reflects database schema evolution best practices, where changes are incremental, backward-compatible, and safely deployable through CI/CD pipelines. Evolutionary design favors extension over replacement.
Performance Pressures and Structural Refinement
With scale comes performance pressure. Queries that once ran instantly now struggle. Reporting workloads introduce new access patterns.
Rather than redesigning everything, the schema evolves structurally to meet new demands.
CREATE INDEX idx_users_status ON users (status);This change does not alter the data model conceptually, but it reflects a deeper understanding of how the system is used. Design evolves not just for correctness, but for operational reality.
Database design is no longer theoretical, it is informed by production behavior.
When the Original Model No Longer Fits
Eventually, teams outgrow early assumptions. A single user’s table can no longer represent multiple user roles, tenants, or identity providers. The model needs refinement. Evolutionary design handles this carefully, through parallel structures and gradual migration.
CREATE TABLE user_profiles (
	user_id INT PRIMARY KEY REFERENCES users(id),
    display_name VARCHAR(150),
    preferences JSONB,
    updated_at TIMESTAMP NOT NULL DEFAULT NOW()
);
Instead of overloading the original table, the design evolves by extracting responsibility. Existing functionality remains stable while new capabilities move forward. At no point was a “big rewrite” required.
The Operational Risks of Unmanaged Database Schema Changes
As changes accumulate, complexity shifts from design to operations. Teams struggle to answer basic questions:
- Which version of the schema is running in production?
- What changes are pending in staging?
- Can this migration be safely rolled back?
This is where evolutionary design demands discipline. Small changes only remain safe when they are visible, validated, and governed.
Why Database DevOps Matters for Schema Evolution?
Modern database design extends beyond tables and columns. It includes how changes are reviewed, tested, approved, and promoted. As applications adopt CI/CD and ship continuously, databases often remain the slowest and riskiest part of the release. Manual migrations, limited visibility, and fear of rollbacks turn schema changes into operational bottlenecks.
Database DevOps addresses this gap by applying software delivery discipline to database changes:
- Schema changes are versioned and traceable
- Migrations are validated before production
- Rollbacks are tested, not improvised
- Audit trails are automatic, preventing high-risk changes from reaching production
By embedding database schema evolution into CI/CD pipelines, teams reduce deployment risk while increasing delivery velocity. Platforms like Harness Database DevOps enable this by combining state awareness, controlled execution, and auditability, making database changes predictable, repeatable, and safe.
The Database as a Record of Learning
Each SQL change tells a story:
- What the system learned
- What assumptions changed
- What scale revealed
- What compliance required
A database is not a monument to early decisions. It is a living artifact that reflects the system’s understanding of its domain at every point in time.
Conclusion: Evolution is the Design
Database design evolution is not a failure of planning, it is evidence of adaptation.
The most resilient systems are not those with perfect initial schemas, but those designed to evolve safely and continuously. By embracing incremental change, versioned history, and automated governance, teams align database design with the realities of modern software delivery.
In a world where applications never stop shipping, database design cannot remain static. They must evolve, with confidence, control, and clarity, supported by Database DevOps practices and platforms such as Harness Database DevOps.
Because in the end, the schema is not the design. The ability to evolve it safely is.

Hot Takes: What the AI Hype Gets Wrong About Software Engineering Excellence
Matthew Skelton is the CEO & CTO of Conflux and a featured speaker at this year’s DevOps Modernization Summit. Ahead of our annual summit, Matthew has shared his hot takes on AI, DORA, and the key to successful automation. We’ve summarized his thoughts below – or watch for yourself.
Hot Take #1: You're Using AI Backwards
The AI gold rush is in full swing. Every engineering leader is under pressure to adopt it, measure it, and show ROI on it. But here's the uncomfortable truth most people aren't saying out loud: AI is having a massive impact on software engineering — and it's still not delivering real value. Most engineering teams start with the tool, then hunt for a use case. That's exactly wrong.
"It's really important for us to come back to the idea of starting with the outcomes first, then working back towards understanding how we'd use AI to empower teams to be effective stewards of value, to reduce cognitive load, to shorten time to do things that are not value add," Matthew shares.
Until you flip that equation — outcomes first, tools second — AI is just expensive noise. Know what problem you're solving before you touch the tooling.
Hot Take #2: AI-Generated Code Is Creating More Work, Not Less
Here's one nobody wants to admit at the all-hands: spinning up AI to generate mountains of code isn't always a productivity win. Sometimes it's just a liability transfer.
"We're not going to use AI to generate mountains of code that then has to be retested and where we find all the security bugs. But we can use it to aid teams to focus on their mission more effectively," according to Matthew.
More code means more review, more vulnerabilities, more cognitive load on already-stretched developers, creating a velocity paradox. The teams winning with AI aren't using it to ship more — they're using it to do less of what doesn't matter.
Hot Take #3: Chasing DORA Metrics Is a Trap
DORA metrics are everywhere. Deployment frequency. Lead time. MTTR. Change failure rate. And they're being misused by almost everyone who tracks them.
"DORA metrics are output metrics. We shouldn't be trying to drive them directly. We need to be looking at the fundamental capabilities — improving our capabilities and expect to see the DORA metrics change,” he says.
Optimizing for the metric instead of the capability is how you get teams gaming numbers while software quality quietly deteriorates. DORA metrics are a thermometer — not a treatment plan.
And there's another inconvenient truth: "The context for using DORA metrics is quite specific — it's teams that have end-to-end responsibility for value flow. And lots of organizations are not in that place."
If your teams don't own the full value stream, DORA might just be the wrong measuring stick entirely.
Hot Take #4: Most Engineering Metrics Aren't Safe to Optimize
The metrics you push on need to be "safe to optimize." Choosing the wrong metrics doesn't just give you bad data — it actively drives behavior you don't want.
"The specific metrics you want to choose very much depend on the context that you're talking about. We need people with a high degree of awareness of the operating context to select the right metrics to empower leaders to be able to push those levers," he states.
Cookie-cutter metric frameworks applied without context are how you end up with fast deployments of broken software. Context is everything.
Hot Take #5: Manual Compliance Is Already Dead — You Just Haven't Admitted It Yet
The pace of change in technology, regulation, and market conditions has blown past what any team can manage through manual inspection.
"The rate of change of technology, of regulatory requirements, of market and economic trading relationships — the rate of change of all these things is too fast for us to have manual inspection of things like security compliance and regulatory compliance," Matthew says.
If your compliance and security processes still depend on humans checking boxes at the end of a release cycle, you're not managing risk — you're manufacturing it. Compliance has to be baked into the platform. Full stop.
Hot Take #6: Automating Compliance Without Building Trust Will Backfire
Here's the nuance that gets lost when teams rush to automate compliance into their delivery platforms: the technology is the easy part.
According to Matthew: "This has to be baked in. But it has to be baked in in a way which builds trust with the people who are, in some cases, on the hook for things like security compliance and regulatory compliance — particularly in financial services."
"In addition to baking compliance into a platform, we need to have a social dynamic inside the organization that builds that trust so that people feel confident that what the platform is doing and controlling is what's needed."
You can automate every security gate in your CI/CD pipeline, but if the compliance team doesn't trust the platform, they'll route around it. Governance is a people problem as much as a technology problem. Build the trust, or the automation won't stick.
The Bottom Line
Engineering excellence in 2026 doesn't go to the team with the most AI tools or the prettiest DORA dashboard. It goes to the teams who are ruthlessly honest about where they're generating real value — and brave enough to act on what the data is actually telling them.
Start with outcomes. Pick metrics that are safe to optimize. Automate compliance with trust baked in alongside it. And stop using AI to generate problems you'll have to fix later.
Want more hot takes? Join this year’s DevOps Modernization Summit and hear straight from industry leaders.

How to Build AI-Native Security Resilience (And Finally Get Developers And Security On The Same Team)
Developers and security professionals have struggled to get on the same page for what seems like forever and AI is only making that divide larger, according to results from our State of AI-Native Application Security 2025 research report.
AI applications are spreading through organizations at a fast rate, in many cases becoming the new “shadow IT” - 62% of our survey takers said they can’t identify where the LLMs are in their organizations, with 75% saying they’re potentially creating much greater risks than ever before. All told, 61% of those surveyed said two-third of their organizations' newly built applications are being designed with AI components.
But are those apps secure? Likely not: 62% of respondents believe AI apps are more vulnerable to cybercriminals than traditional IT applications and over two-thirds of survey takers report already experiencing an attack on an AI application.
And, unfortunately, dev and sec teams aren’t facing this problem together, at least according to our findings. Survey takers said:
- Developers lack time and training: 62% say devs are too busy to implement comprehensive AI-native security, and the same percentage say they lack the necessary expertise.
- Speed and security are mismatched: 75% believe AI applications evolve faster than security can keep up.
- Collaboration breakdowns are widening the gap: Only 34% of developers notify security before starting AI projects, and just 53% before going live.
- Perception remains a barrier: 74% of security leaders say developers view security as a blocker to AI innovation.
But, organizations can unlock the value of their AI investments *and* make them more secure at the same time, while, (bonus!), bringing security pros and developers together - if they commit to building AI-native security resilience. This is a mindset and culture shift, perhaps of monumental proportions, but we promise the payoff is worth it. Here’s how to get started:
Lay the groundwork with shared governance
Manual reviews are tedious, prone to human error, and can double or triple the wait times for approval. To break that cycle, opt for Policy as Code rather than manual reviews, building something that engineering and security agree upon beforehand. That could look like security defining policies that devs embed into CI/CD pipelines and violations that trigger automated feedback rather than blocking progress.
This is a great place to start - or stress - a true “shift left” mentality.
Make AI components discoverable
AI components can’t be secure if they’re not seen. Teams need to monitor and log all AI components, of course, but the organization needs to make it as easy as possible to use safe and sanctioned AI tools. Shadow AI only gets worse when the “official tools” are difficult to use.
Detect anomalies by tracking AI implementations in real-time
Normal rules won’t apply here, so instead teams need to look at model behavior (sudden spikes or abnormal token usage), security signals (prompt injection patterns or hidden tool calls), and operational (cost anomalies or context window size spikes). Also consider building real-time guardrails with policy automation that can throttle model calls or downgrade agent permissions.
Test dynamically against AI-specific threats
Up your testing game with specific threat catalogs including OWASP Top 10 for LLM Apps and MITRE ATLAS and don’t forget the TEVV concepts. A dedicated security test harness can be particularly helpful here, as can adversarial “prompt fuzzing.”
Don’t forget to protect what’s already in production
In the immortal words of Fox Mulder “trust no one,” or in this case, don’t trust *any* of the AI inputs and outputs. Enforce data classification and context boundaries, secure the model interaction layer, and make sure to monitor the behavior and not just the infrastructure.
FAQs on AI-Native Security Resilience
What does "AI-native security resilience" actually mean in practice?
AI-native security resilience means security isn't a gate at the end of the pipeline — it's woven into every stage of delivery. Harness uses contextual insights and agentic workflows to detect and mitigate risks from build to post-deployment, covering everything from application and API discovery to AI-powered threat prevention.
How does Harness help security and developer teams work from the same playbook?
The merger of Harness and Traceable enables software teams to seamlessly develop, deploy, and secure applications, ensuring security is embedded at every stage of the software lifecycle. By unifying DevOps and AppSec in a single platform, both teams operate with the same pipeline context — eliminating the handoff friction that traditionally breaks collaboration.
How does Harness reduce the burden on developers when it comes to fixing vulnerabilities?
Harness AI streamlines the process of fixing vulnerabilities, enabling developers and security personnel to manage security backlogs, address critical issues promptly, and generate code suggestions and pull requests to remediate issues directly from the security testing orchestration (STO) module.
With shadow AI becoming a major enterprise risk, how does Harness help organizations stay in control?
Harness addresses AI visibility through the Software Delivery Knowledge Graph — a contextual layer that maps a company's security policies, compliance requirements, infrastructure, and development practices — so AI agents can enforce guardrails automatically, rather than relying on developers to remember them.

Cloud Cost Optimization: Why Your Approach Is Broken
If cloud cost optimization feels like a never-ending game of whack-a-mole—new recommendations every 30 days, the same debates with engineering, another set of dashboards no one trusts—you’re not alone.
But what if your cloud cost optimization strategy is the reason your AWS bill keeps climbing?
Not the lack of one.
Not poor execution.
The strategy itself.
We've seen this pattern dozens of times: teams implement tagging standards, build dashboards, schedule monthly FinOps reviews, and still watch costs spiral. The infrastructure is tagged. The metrics exist. The meetings happen. Yet every quarter, the CFO asks the same uncomfortable question:
“Why are we spending this much?”
The problem usually isn’t the idea of optimization. It’s the approach: too reactive, too late in the lifecycle, and too disconnected from how software is actually built and shipped.
And in high-velocity engineering environments, that gap between deployment and optimization review is exactly where runaway spend lives.
Why Traditional Cloud Cost Optimization Strategies Fail at Scale
Most organizations adopt a cloud cost management approach that sounds reasonable:
Deploy infrastructure → monitor spend → identify anomalies → remediate issues → repeat.
This is the classic “observe and optimize” model, borrowed from decades of on-premises capacity planning.
It breaks in the cloud.
In traditional datacenters, provisioning took weeks. Infrastructure decisions went through multiple approval layers. The natural friction slowed spend.
In cloud environments, engineers can provision thousands of dollars of compute in minutes. The speed that makes cloud infrastructure powerful also makes reactive cost optimization dangerously slow.
The Monthly Treadmill Problem
A huge reason teams feel like they’re starting over every month is that the default workflow looks like this:
Spend happens
A report shows waste
FinOps sends recommendations
Engineering says “not now”
Repeat next month
Even if your team is doing all the “right” things—rightsizing, commitments, idle cleanup, non-prod shutdown—you’re still reacting to what already happened.
And if your cloud spending optimization depends on sporadic human follow-through, you’ll keep reliving the same cycle.
The Reporting Trap
The most common failure mode we encounter is what we call “the reporting trap.”
Organizations invest heavily in cost visibility dashboards, allocation reports, and trend analysis, then wonder why costs don't improve.
The reports show what happened.
They rarely prevent what’s about to happen.
Consider a typical scenario: an engineering team deploys a new microservice on Friday. It includes an RDS instance sized for anticipated peak load, plus a few EC2 instances running 24/7 for background processing.
The deployment succeeds. The service works.
Two weeks later, someone notices the RDS instance costs $3,000/month and runs at 12% utilization. By the time this surfaces in a cost review, you’ve burned $6,000.
Reporting-based infrastructure cost optimization identifies problems. It doesn’t prevent them.
And in CI/CD environments shipping multiple times per day, prevention matters far more than detection.
The Allocation Illusion
Another common broken strategy: obsess over cost allocation and chargeback models.
Get the tagging right.
Assign every dollar to a team.
Generate showback reports.
Declare victory.
Allocation solves an accounting problem. It doesn’t solve an engineering problem.
Knowing which team caused overspend doesn’t stop the next deployment from repeating the same mistake. It creates visibility into financial responsibility without creating controls that prevent waste.
Effective cloud cost governance requires allocation and guardrails. You need to know who’s spending—but you also need mechanisms that stop obviously wasteful configurations from ever reaching production.
FinOps Best Practices: Finance + DevOps (And That’s the Point)
A lot of cloud cost optimization strategies fail because they treat FinOps as:
- a tool
- a tagging project
- a finance initiative
- a savings sprint
- “finance trying to cut engineering’s budget”
But mature FinOps best practices are built around collaboration:
Finance, engineering, infrastructure/platform teams, and business owners operating from the same data and goals—even if their priorities differ.
- Finance wants predictability and accountability
- Engineering wants velocity and reliability
- Platform teams want consistency and governance
- Business owners want clear unit economics and value delivery
When those groups operate in silos, cloud bills become a mystery, optimization becomes political, and waste becomes “the cost of doing business.”
A mature cloud cost optimization strategy flips that. It makes spend a shared responsibility—with shared context.
What Cloud Cost Optimization Should Actually Look Like
A working cost optimization framework starts from a different premise:
Cost decisions should happen at the same place and time as infrastructure decisions.
Not in a dashboard two weeks later.
Not in a quarterly business review.
In the pull request.
In the Terraform plan.
In the CI/CD pipeline before deployment.
Shift Cost Controls Left (Shift-Left FinOps)
The biggest step-change happens when you stop treating cloud cost reduction strategy work as an operational clean-up task—and start treating cost governance as a software delivery design constraint.
That’s what “shift left” means in a cost context: bringing optimization upstream into the provisioning and deployment workflow before overspend becomes production reality.
Because engineers don’t overprovision out of malice. They do it because their job is reliability:
- “Let’s size for the spike.”
- “Let’s pick the robust instance.”
- “Let’s over-allocate just in case.”
And then utilization never reaches what was provisioned.
Shift-left changes the default by putting guardrails and approved patterns into the path engineers already use to ship software—so cost control doesn’t require constant cost review meetings.
Think Roads, Not Speeding Tickets
A useful mental model is roads and cars:
Applications are the cars.
Infrastructure is the road system.
Roads set the rules—speed limits, exits, lanes—not the cars.
When your platform and provisioning workflows define the safe, optimized options, you reduce chaos and make the right choice the easy choice.
That’s what scalable cloud cost governance actually looks like.
“Zero Drift”: Don’t Just Set Guardrails—Keep Them
Once you shift left, the next question is:
How do you prevent teams from gradually drifting away from the intended standard?
That’s where the concept of zero drift comes in.
Zero drift is the idea that the desired state (cost-aware, governed, optimized) is continuously enforced through automation—so you aren’t babysitting optimization forever.
Humans shouldn’t be the control plane.
In practice, zero drift means:
- provisioning is standardized and policy-driven
- instance/cluster choices are constrained to approved configurations
- optimization actions (like rightsizing) can be automated with confidence
- anomalies are monitored, investigated, and resolved without breaking the system
Instead of monthly restarts, you get continuous alignment.
This is the difference between a cloud cost management approach that scales and one that collapses under velocity.
Tagging: Necessary, Painful… and Still a Common Failure Mode
Let’s address the elephant in the room: visibility.
If you can’t reliably answer “who is spending what, and why?” you can’t run FinOps at scale.
And yet, even in large organizations, tagging quality is frequently the weak link. Many companies can’t attribute the vast majority of spend with high confidence.
That’s not just an administrative issue—it’s a blocker for automation.
You can’t automate decisions against spend you can’t confidently attribute.
The takeaway is simple:
Treat attribution as foundational, but don’t stop there. Mature FinOps doesn’t end at “better tags.” It moves toward system-enforced governance and workload-level controls that reduce dependence on perfect tagging for every single decision.
The Pivot: From Savings to Unit Economics (and Business Value)
Most teams eventually hit diminishing returns on classic savings levers:
- Reserved instances / savings plans
- basic rightsizing
- cleaning up idle resources
- non-prod stopping
- commitment discounts
At some point, you’ve harvested the low-hanging fruit.
The next question becomes:
How do we define—and improve—the value of every cloud dollar going forward?
That’s where unit economics comes in.
Instead of asking “How much did we save?” you ask:
- What does it cost per customer?
- Per transaction?
- Per workload?
- Per feature, environment, or product line?
This reframes cloud cost reduction strategy work from “cost cutting” to “value engineering.”
And it’s one of the clearest signals that your cloud cost optimization strategy has matured.
How Harness Cloud Cost Management Approaches This Problem
Harness Cloud Cost Management is built around the premise that cost optimization happens in the engineering workflow, not after it.
Instead of treating cost management as a separate finance function, it integrates cost visibility and governance directly into CI/CD pipelines, infrastructure provisioning workflows, and day-to-day development processes.
Cost Visibility Across Your Entire Cloud Estate
Harness provides unified cost visibility across AWS, Azure, GCP, and Kubernetes clusters, with automatic allocation by team, service, environment, and business unit.
You get real-time dashboards showing exactly where spend is happening, down to individual workloads and namespaces.
Cost anomaly detection highlights unexpected changes automatically, with alerts routed directly to responsible engineering teams.
This supports both showback and chargeback models—without creating manual reporting overhead. Teams see their spend in real time, not weeks after the invoice closes.
In-Workflow Cost Governance
Where Harness differs from traditional tools is how governance works.
Cost policies enforce directly in CI/CD pipelines and infrastructure-as-code workflows.
Before a Terraform plan applies, Harness evaluates estimated costs against defined budgets and thresholds. If a deployment would exceed limits, the pipeline fails with clear feedback on what needs to change.
This creates a natural feedback loop where engineers see cost impacts immediately—while they still have full context on the infrastructure decisions being made.
It prevents expensive mistakes from reaching production rather than identifying them later through reporting.
Harness also supports automated optimization recommendations, including:
- rightsizing suggestions
- idle resource cleanup
- non-prod stopping automation
- commitment-based discount opportunities
Teams can implement these recommendations directly through the same pipelines they use for regular infrastructure changes.
Built for Engineering-Led Cost Optimization
Harness treats cloud cost management as an engineering problem, not a finance problem.
The platform integrates with existing tools (GitHub, GitLab, Jira, Slack) and workflows (Terraform, CloudFormation, Kubernetes) rather than requiring separate processes.
Engineers interact with cost data in the same interfaces they already use for infrastructure management.
Policy enforcement is flexible but opinionated:
Default guardrails prevent common waste patterns (idle resources, oversized instances, untagged infrastructure) while allowing teams to define exceptions for legitimate use cases.
The goal is to make cost-efficient choices the path of least resistance—not to create approval bottlenecks.
For organizations managing cost at scale, Harness supports advanced workflows like:
- environment-based budgets (dev/staging/production)
- cost allocation hierarchies (business units, products, teams)
- integration with business metrics for cost-per-transaction analysis
Fixing Your Cloud Cost Optimization Approach
If your current cloud cost optimization strategy feels broken, you’re probably optimizing the wrong thing.
Cost visibility and allocation are necessary, but they’re not sufficient.
Real cost control happens when engineers see cost impacts before deployment, not when finance reviews invoices after.
A working cost optimization framework:
- embeds cost awareness directly into CI/CD and IaC workflows
- combines proactive guardrails with real-time visibility
- uses automation to prevent drift
- measures success by cost efficiency and unit economics—not just raw spend reduction
Reactive cloud spending optimization scales poorly in high-velocity engineering environments.
Proactive cloud cost governance scales effortlessly.
Ready to shift cost controls left? Start with Harness Cloud Cost Management and see what engineering-native cost optimization looks like in practice.
What To Go Deeper?
Watch our webinar, Cloud Cost Optimization Isn't Broken_The Approach is to learn more.
Learn more about how Harness Cloud Cost Management works or explore the CCM documentation.

Engineering Metrics Success: Communicate Speed, Quality, and Business Outcomes
Engineering organizations are waking up to something that used to be optional: measurement.
Not vanity dashboards. Not a quarterly “engineering metrics review” that no one prepares for. Real measurement that connects delivery speed, quality, and reliability to business outcomes and decision-making.
That shift is a good sign. It means engineering leaders are taking the craft seriously.
But there are two patterns I keep seeing across the industry that turn this good intention into a slow-motion failure. Both patterns look reasonable on paper. Both patterns are expensive. And both patterns lead to the same outcome: a metrics tool becomes shelfware, trust erodes, and leaders walk away thinking, “Metrics do not work here.”
Engineering metrics do work. But only when leaders use them the right way, for the right purpose, with the right operating rhythm.
Here are the two patterns, and how to address them.
Pattern #1: “We bought the tool, gave it to leaders, and expected behavior to change”
This is the silent killer.
An engineering executive buys a measurement platform and rolls it out to directors and managers with a message like: “Now you’ll have visibility. Use this to improve.”
Then the executive who sponsored the initiative rarely uses the tool themselves.
No consistent review cadence. No decisions being made with the data. No visible examples of metrics guiding priorities. No executive-level questions that force a new standard of clarity.
What happens next is predictable.
Managers and directors conclude that engineering metrics are optional. They might log in at first. They might explore the dashboards. But soon the tool becomes “another thing” competing with real work. And because leadership is not driving the behavior, the culture defaults to the old way: opinions, anecdotes, and local optimization.
If leaders are not driving direction with data, why would managers choose to?
This is not a tooling problem. It is a leadership ownership problem.
What to do instead: make metrics executive-owned, not manager-assigned
If measurement is important, the most senior leaders must model it.
That does not mean micromanaging teams through numbers. It means creating a clear expectation that engineering metrics are part of how the organization thinks, communicates, and makes decisions.
Here is what executive ownership looks like in practice:
- The executive sponsor uses the tool publicly. In staff meetings, in reviews, in planning, in post-incident discussions.
- Metrics show up in decision moments. Prioritization, investment tradeoffs, risk calls, capacity conversations.
- Leaders ask better questions because they have data. Not “Why are you slow?” but “What is slowing you down, and what would move it?”
- A consistent cadence exists. Not random dashboard reviews. A repeatable operating rhythm.
When executives do this, managers follow. Not because they are told to, but because the organization has made measurement real.
Pattern #2: “Buying a measurement tool will fix our engineering problems”
This is the other trap, and it is even more common.
There is a false belief that if an organization has DORA metrics, improvements in throughput and quality will automatically follow. Like measurement itself is the intervention.
But measurement does not create performance. It reveals performance.
A tool can tell you:
- how long changes take to reach production
- how often you deploy
- how frequently you experience failure
- how quickly you recover
Those are powerful signals. But they do not change anything on their own.
If the system that produces those numbers stays the same, the numbers stay the same.
This is why organizations buy tools, instrument everything, and still feel stuck. They measured the pain, but never built the discipline to diagnose and treat the cause.
What to do instead: treat engineering metrics as instrumentation, not transformation
If you want metrics to lead to improvement, you need two things:
- Clear definitions and shared understanding
- A metrics practice that turns numbers into decisions and experiments
Without definitions, metrics turn into arguments. Everyone interprets the same number differently, then stops trusting the system.
Without a practice, metrics turn into observation. You notice, you nod, then you go back to work.
The purpose of measurement is not to create pressure. It is to create clarity. Clarity about where the system is constrained, what tradeoffs you are making, and whether your interventions actually helped.
The real goal: measure change, not teams
Here is the shift that unlocks everything:
The goal is not to measure engineers.
The goal is to measure the system.
More specifically, the goal is to prove whether a change you made actually improved outcomes.
A change could be:
- a tooling change
- a process change
- a policy change
- a staffing or org change
- a reliability investment
- a platform improvement
- a CI/CD modernization effort
If you cannot measure movement after you make a change, you are operating on opinions and hope.
If you can measure movement, you can run engineering like a disciplined improvement engine.
This is where DORA metrics become extremely valuable, when they are used as confirmation and learning, not as a scoreboard.
Engineering metrics should confirm reality, not replace judgment
The best leaders I have worked with do not hand leadership over to dashboards. They use metrics as confirmation of what they already sense, and as a way to test assumptions.
- “We believe code reviews are a bottleneck. Do we see it in cycle time breakdowns?”
- “We believe flaky tests are slowing delivery. Do we see increased rework or longer lead time?”
- “We believe incident recovery is too manual. Do we see MTTR improve after automation?”
- “We believe our deployment process is too risky. Does change failure rate drop after we change release strategy?”
That is the role of measurement. It turns gut feel into validated understanding, then turns interventions into provable outcomes.
A practical operating model that works
If you want measurement to drive real improvement, here is a straightforward structure that scales.
1) Define what “good” means in your context
Use DORA as a baseline, but make definitions explicit:
- What counts as a deployment?
- What counts as a production failure?
- How do you define lead time?
- How do you define recovery?
This prevents endless debates and keeps the organization aligned.
2) Establish a simple cadence
You do not need a heavy process. You need consistency.
A strong starting point:
- Weekly: team-level review of flow and reliability signals, focused on removing friction
- Monthly: leadership review focused on trend movement, constraints, and investments
- Quarterly: strategic review to decide where to focus improvement efforts next
3) Pair every metric with a lever
A metric without a lever becomes a complaint.
Examples:
- If lead time is high, what levers do you pull?
- reduce batch size, improve trunk-based practices, improve test speed, remove manual approvals
- reduce batch size, improve trunk-based practices, improve test speed, remove manual approvals
- If change failure rate is high, what levers do you pull?
- improve testing strategy, release safety patterns, observability, rollback mechanisms
- improve testing strategy, release safety patterns, observability, rollback mechanisms
- If MTTR is high, what levers do you pull?
- better alerting, runbooks, ownership clarity, automated remediation, incident practices
- better alerting, runbooks, ownership clarity, automated remediation, incident practices
4) Run experiments and measure outcomes
This is the part most organizations skip.
Pick one change. Implement it. Measure before and after. Learn. Repeat.
Improvement becomes a system, not a motivational speech.
5) Make leaders the model
This brings us back to Pattern #1.
If executives use the tool and drive decisions with it, measurement becomes real. If they do not, the tool becomes optional, and optional always loses.
Where the best organizations land
The organizations that do this well eventually stop talking about “metrics adoption.” They talk about “how we run the business.”
Measurement becomes part of how engineering communicates with leadership, how priorities get set, how teams remove friction, and how investment decisions are made.
And the biggest shift is this:They stop expecting a measurement tool to fix problems.They use measurement to prove that the problems are being fixed.
That is the point. Not dashboards, not reporting, not performance theater: Clarity, decisions, experiments, and outcomes.
In the end, measurement is not the transformation. It is the instrument panel that tells you whether your transformation is working.
The Modern Software Delivery Platform®
Need more info? Contact Sales