Featured Blogs

Key Takeaway: The Harness MCP Server is now in the official Claude Connectors Directory. Developers using Claude can now discover and connect to Harness, gaining structured, real-time access to their pipelines, deployments, approvals, and delivery workflows. What makes this different from a typical API integration is what's underneath: the Harness Software Delivery Knowledge Graph, which gives Claude the context it needs to make decisions that are accurate, fast, and safe.
AI agents are only as good as the context they operate in. That's not a design philosophy. It's a practical constraint. An AI agent that doesn't understand how the underlying software delivery entities relate to each other, or what the data actually means, will get things wrong. In software delivery, wrong looks like a botched deployment, a misread failure, or an approval granted when it shouldn't have been, which directly affects your users.
Today, we're announcing that the Harness MCP Server is in the official Claude Connectors Directory, making Harness discoverable and connectable for every team using Claude. But the announcement isn't really about the directory listing. It's about what Harness + Claude can actually do in your delivery system.
What You Can Do with Claude and Harness
Claude can work across the full Harness delivery platform:
All of it is grounded in the Knowledge Graph, not raw API responses, but a structured model of your delivery system that Claude can reason over precisely.
The Problem With Giving AI Agents Raw API Access
MCP lets AI models call external tools by reading API descriptions and deciding which to invoke. That flexibility is useful. But when you're building an agent that needs to reason across an entire software delivery lifecycle, CI, CD, security scans, approvals, feature flags, cost signals, and environments, raw API access creates a deep reliability problem.
Consider a question a platform engineering lead might ask:
"Show me the pipelines with the highest failure rate over the last 30 days, and for each one, tell me which services they deploy and whether any of those services have open critical vulnerabilities."
That question spans four domains: pipeline execution history, service-to-pipeline relationships, environment state, and security scan results. An agent working off raw APIs has to discover which APIs exist across each domain, call them in the right order, paginate correctly, infer how field names correspond across systems, and synthesize the results without misinterpreting nested objects or guessing at relationships.
The result is 5+ sequential LLM calls, hundreds of thousands of input tokens, high latency, and an agent that had to guess at every join. Guessing is where hallucinations happen.
What the Harness + Claude Integration Changes
The Harness Software Delivery Knowledge Graph is a purpose-built model of everything that happens after code is written: builds, test runs, deployments, approvals, security scans, environment states, feature flags, infrastructure changes, cost signals, and rollbacks. Not as raw data but as a connected, typed, semantically annotated graph of entities and relationships.
Every field in the graph carries metadata that tells an agent exactly how to use it: whether a value is a number or a string, whether it can be aggregated or only filtered, what its unit is, and how it joins to related entities. Cross-module relationships, between a pipeline and the services it deploys, between a deployment and the security scan results for that artifact, between an environment change and the cost anomaly that followed, are explicitly declared, not inferred.
This is the difference between an agent that can access your delivery system and one that understands it.
When Claude connects to Harness via MCP, it doesn't receive a set of API endpoints. It's getting access to a structured model of your entire delivery organization, one where the relationships are known, the data types are enforced, and the agent can construct precise queries rather than guessing at field semantics.
The practical effect with Harness + Claude: that same cross-domain question above becomes 2–3 structured queries against a known schema. The agent selects the right entity types from the graph, generates queries with exact fields and declared relationships, and returns a deterministic answer. No guesswork. No hallucinated field names. No silent wrong answers.
What This Looks Like in Practice
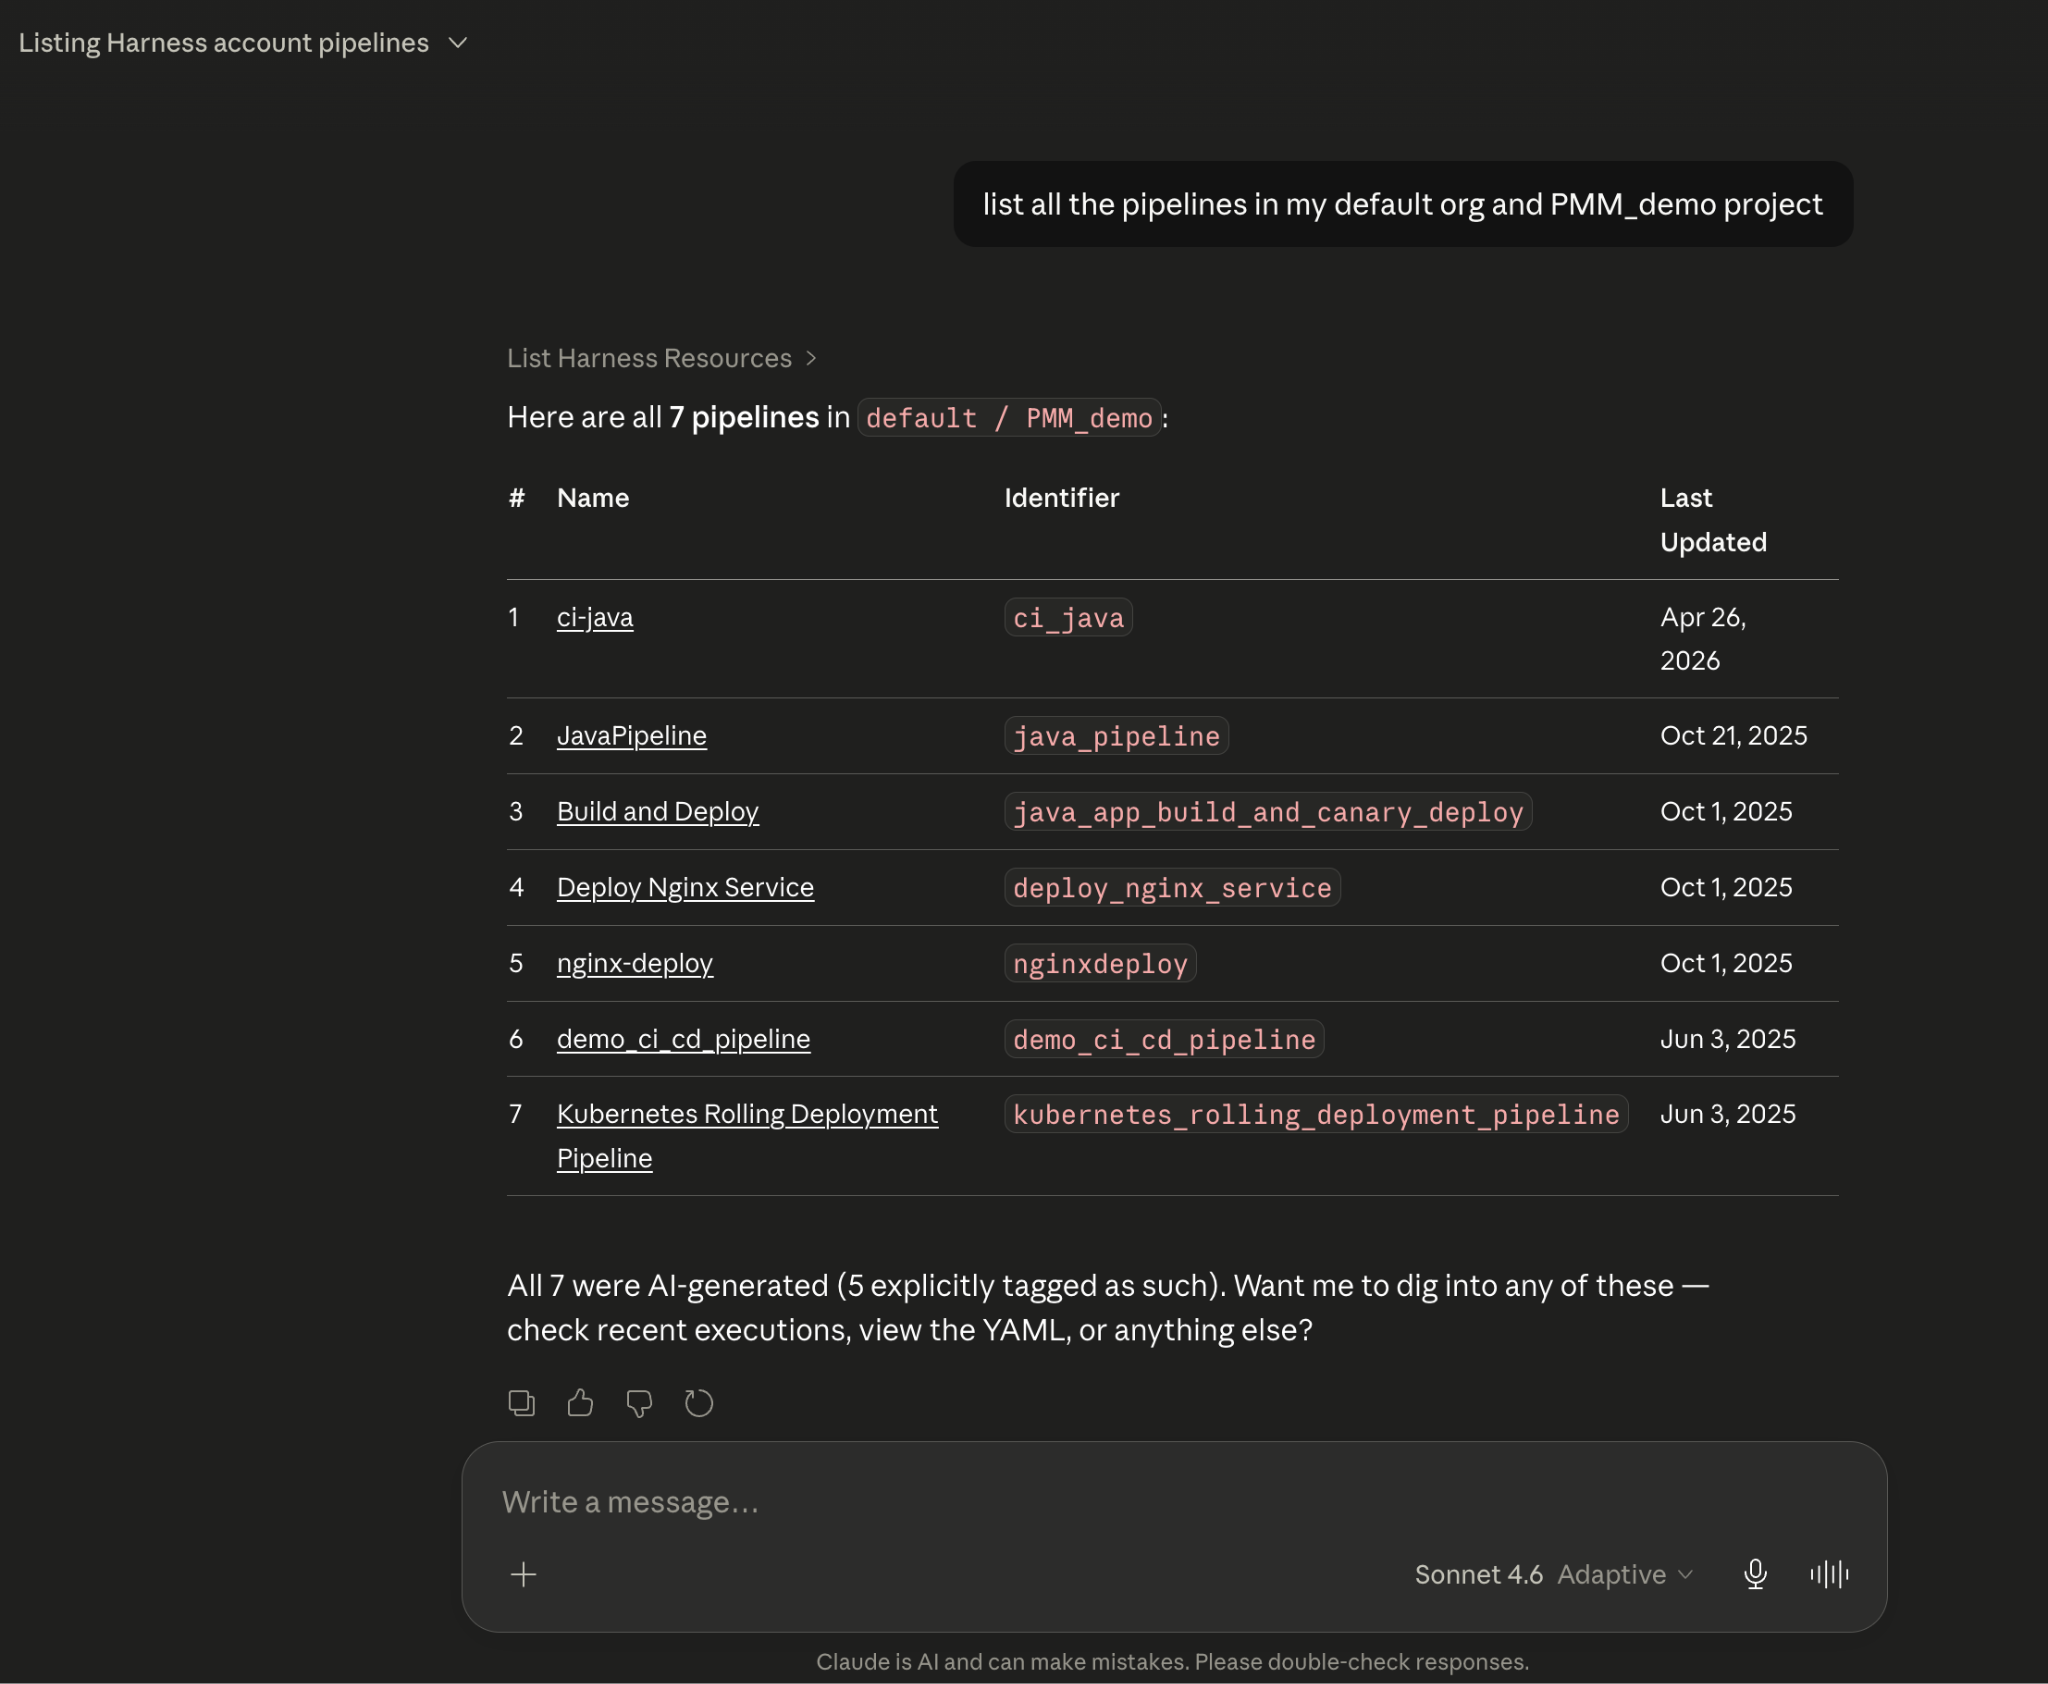
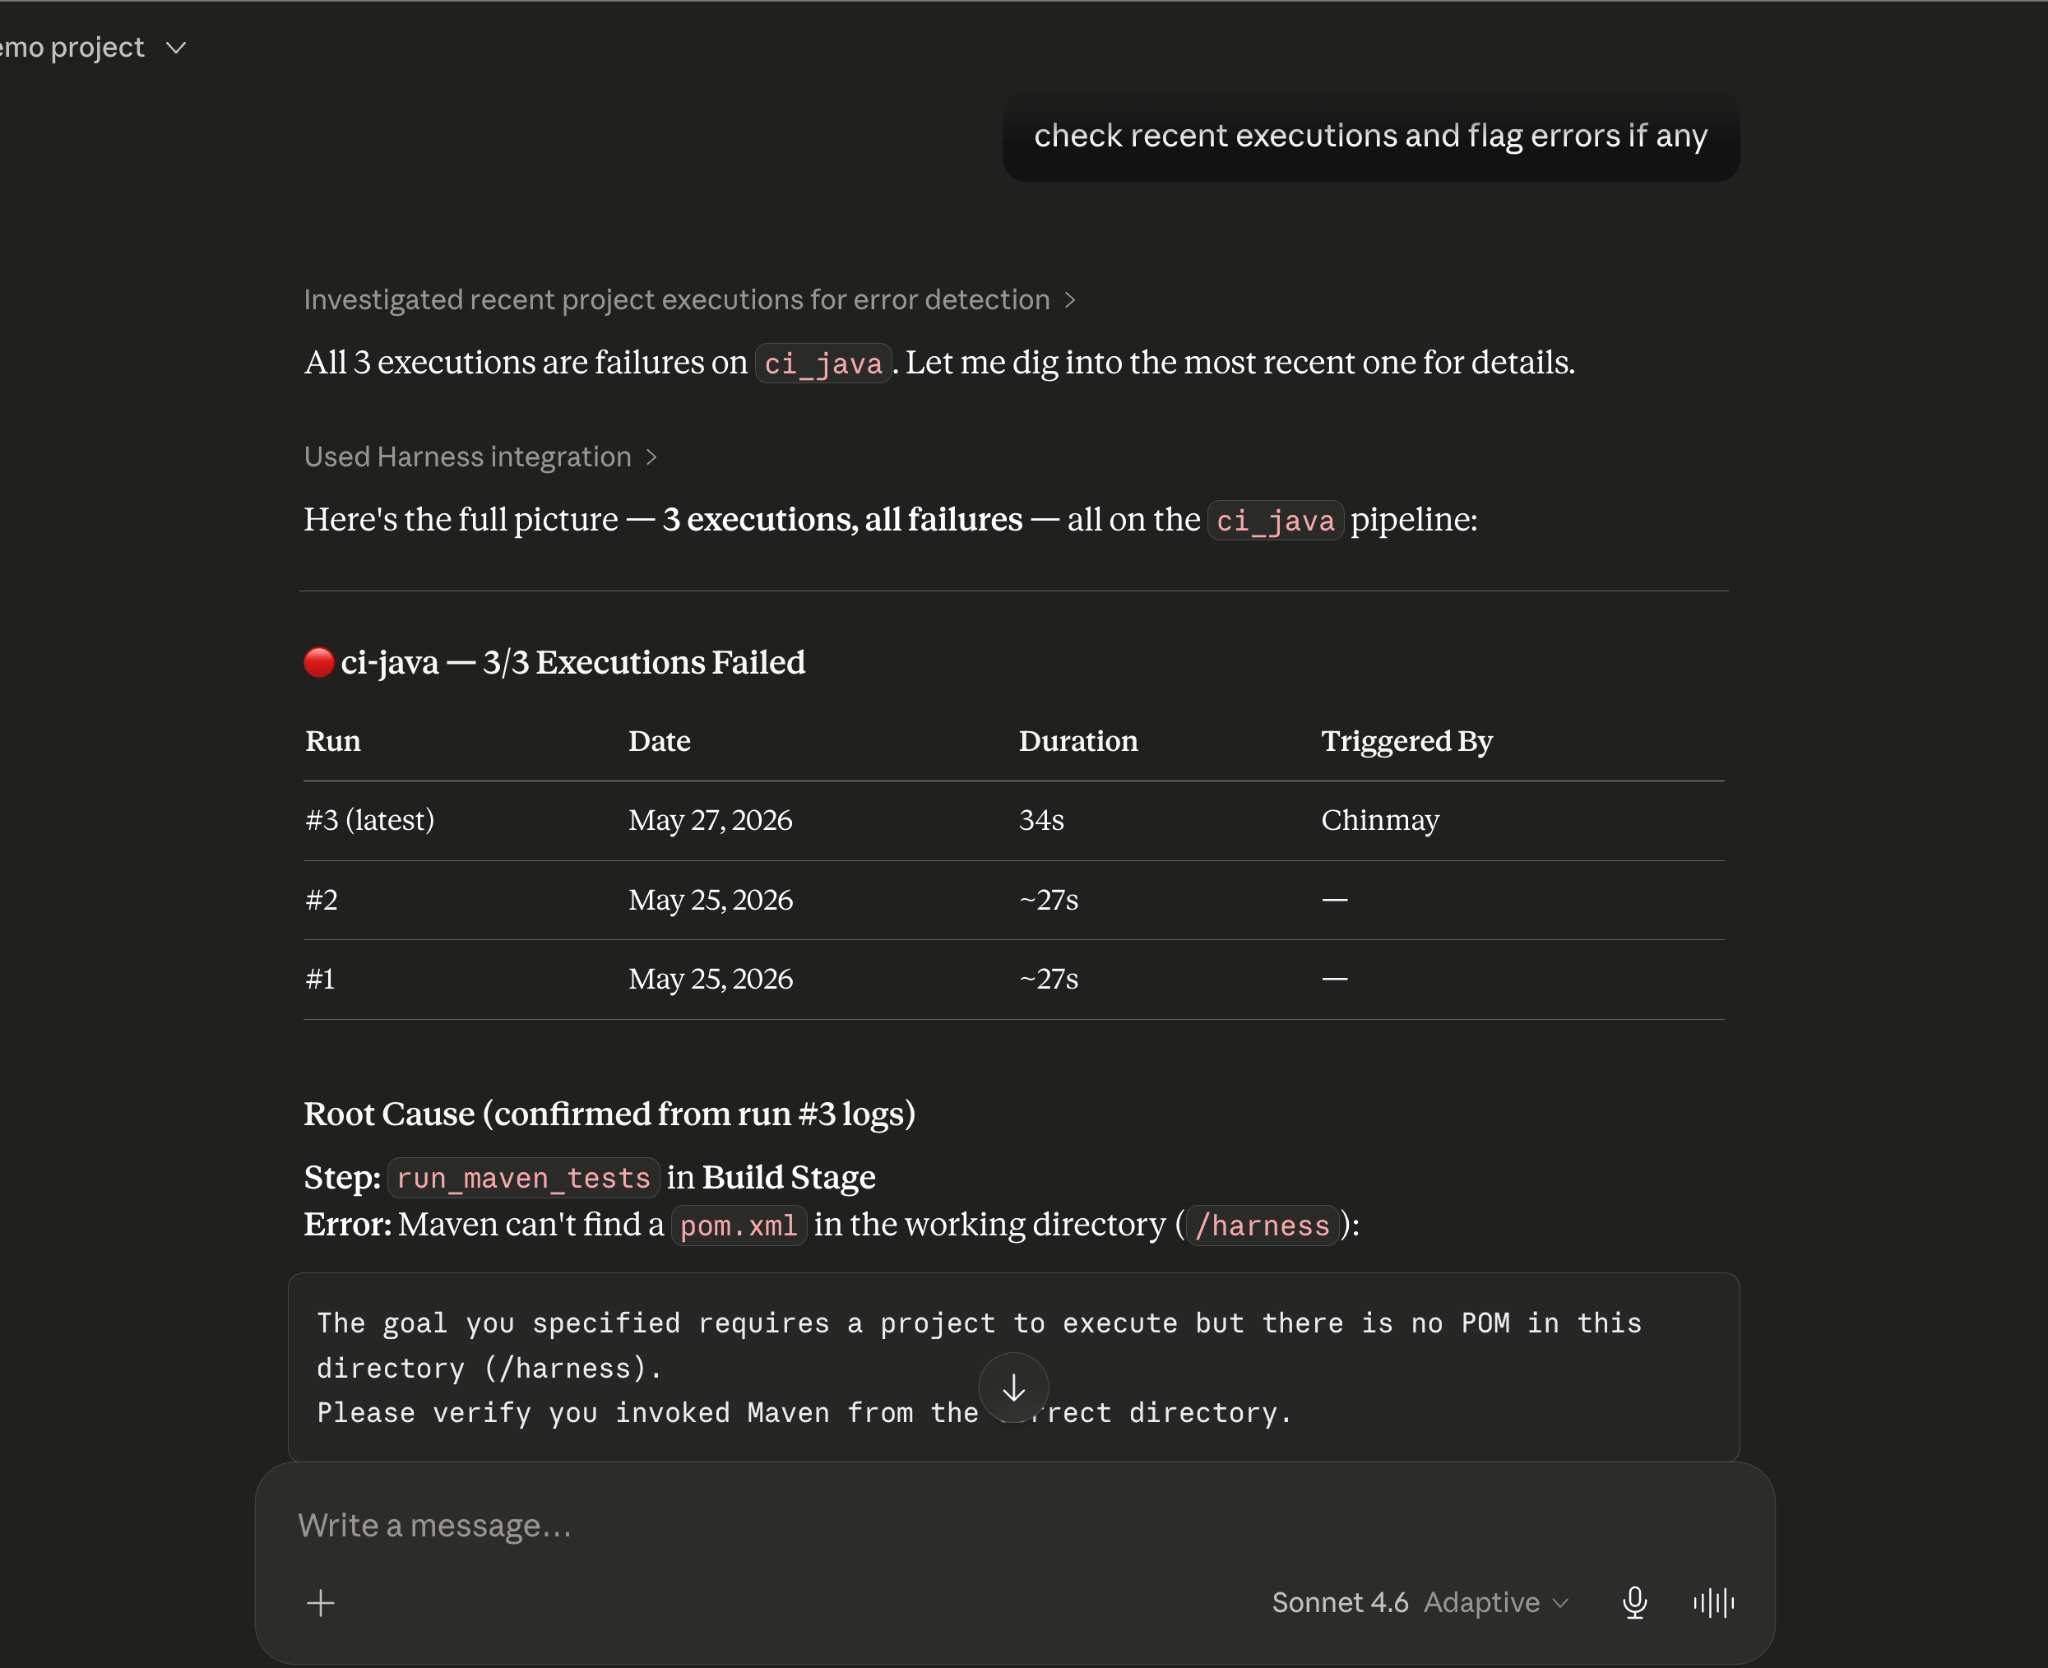
Debugging a failed pipeline without context switching
A build has failed. Normally, you'd open the Harness UI, navigate to the execution, copy the relevant logs, paste them into a conversation, and wait for analysis. The AI reasons over whatever you managed to capture.
With the Harness MCP connection active in Claude, you ask what failed. Claude doesn't just pull logs; it queries the Knowledge Graph to understand the structure of that pipeline, which stage failed, what services were involved, whether similar failures have occurred before, and what changed since the last successful run. The answer it surfaces reflects the full delivery context, not just the stack trace you happened to copy.
Promoting a deployment through governed gates
Your team is ready to move a service from staging to production. Claude checks the current environment state, verifies that required approval gates have been satisfied, confirms the security scan passed for the artifact version you're promoting, and initiates the deployment — with every action running through your existing RBAC policies and logged for audit.
The agent isn't guessing about whether conditions are met. It's querying a graph where those conditions are modeled as typed relationships with known states. The answer is deterministic because the data is structured to make it so.
This Is Not AI Without Guardrails
The natural question when Claude can trigger pipelines and manage deployments: what stops it from doing something it shouldn't?
The same controls that govern everything else in Harness. Every action taken through the MCP server runs through your existing RBAC permissions, OPA policy enforcement, approval gates, and audit logging. Claude operates with exactly the permissions you have, nothing more. Every action is tracked. Nothing bypasses the governance layer.
The Knowledge Graph reinforces this: because Harness AI understands your delivery system structurally, it also understands the constraints within it. Approval gates aren't just optional steps the agent might skip; they're modeled as typed relationships with state. The agent can't promote past a gate that hasn't cleared because the graph reflects that clearly.
Speed and governance aren't a tradeoff. They coexist by design.
Why the Claude Connectors Directory Matters
The Claude Connectors Directory is a curated, reviewed set of integrations. Anthropic evaluates each server before listing it. Being approved is a signal of trust that carries weight for enterprise teams deciding which AI integrations to enable.
It also means discoverability at scale: engineering teams using Claude for DevOps workflows will find Harness natively. One-click OAuth connection, no API key management, no manual configuration.
This fits a broader pattern. The Google Cloud partnership brought Harness into Google's AI ecosystem through Vertex AI and Gemini CLI. The Cursor plugin brought it into the IDE. The Claude Connectors Directory brings it into conversational AI. In each case, the goal is the same: wherever developers are doing their best thinking and wherever AI is being asked to help with software delivery, Harness should be present with the right context for that AI to act reliably.
Getting Started
If you're already a Harness customer:
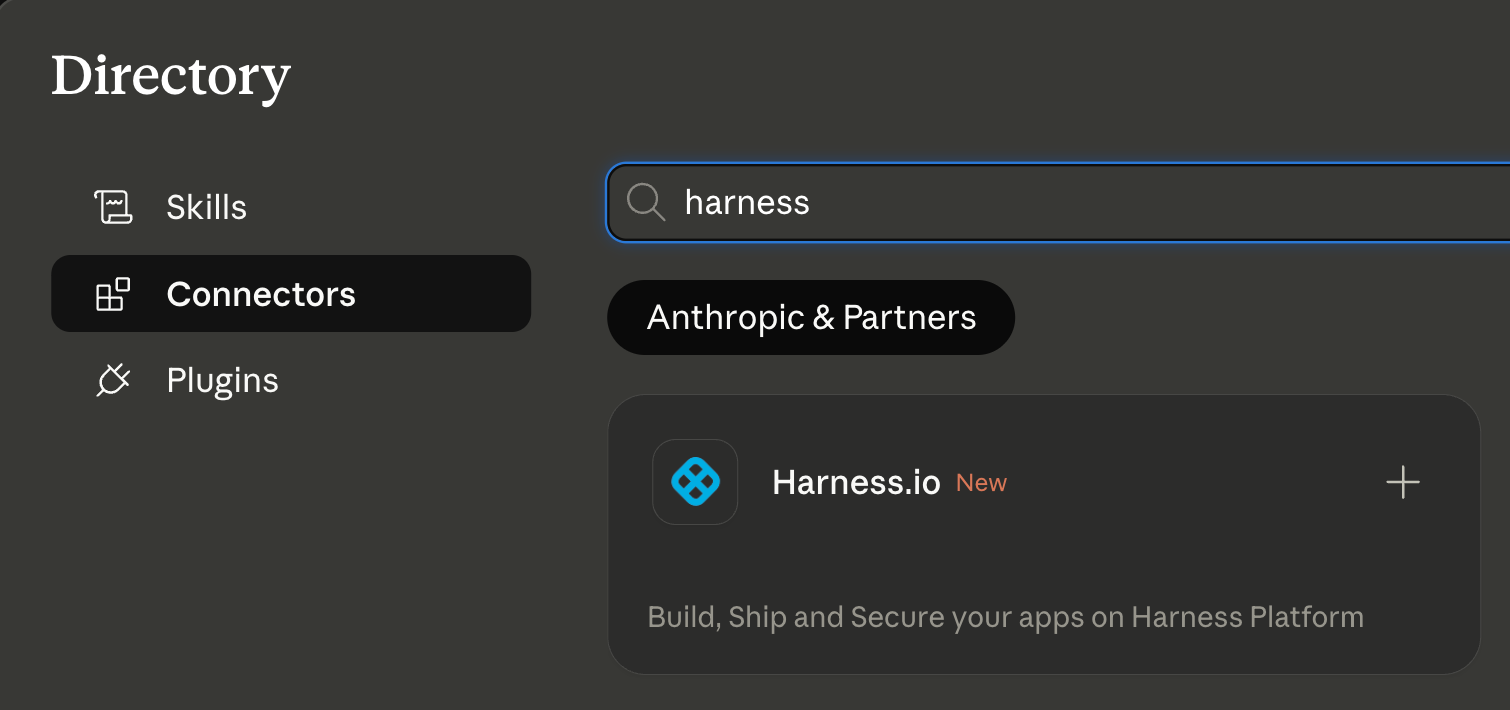
- Open Claude and then the Connectors page
- Search for Harness in the MCP directory
- Authenticate with OAuth, no API keys, no manual configuration
- Start asking Claude about your pipelines, deployments, and delivery workflows
If you're new to Harness, sign up for free and connect from day one. Detailed steps are listed in the documentation.
The Harness Connector gives Claude the ability to act in your delivery system. The Knowledge Graph gives it the understanding to act well. Together, that's what reliable AI in software delivery actually looks like.

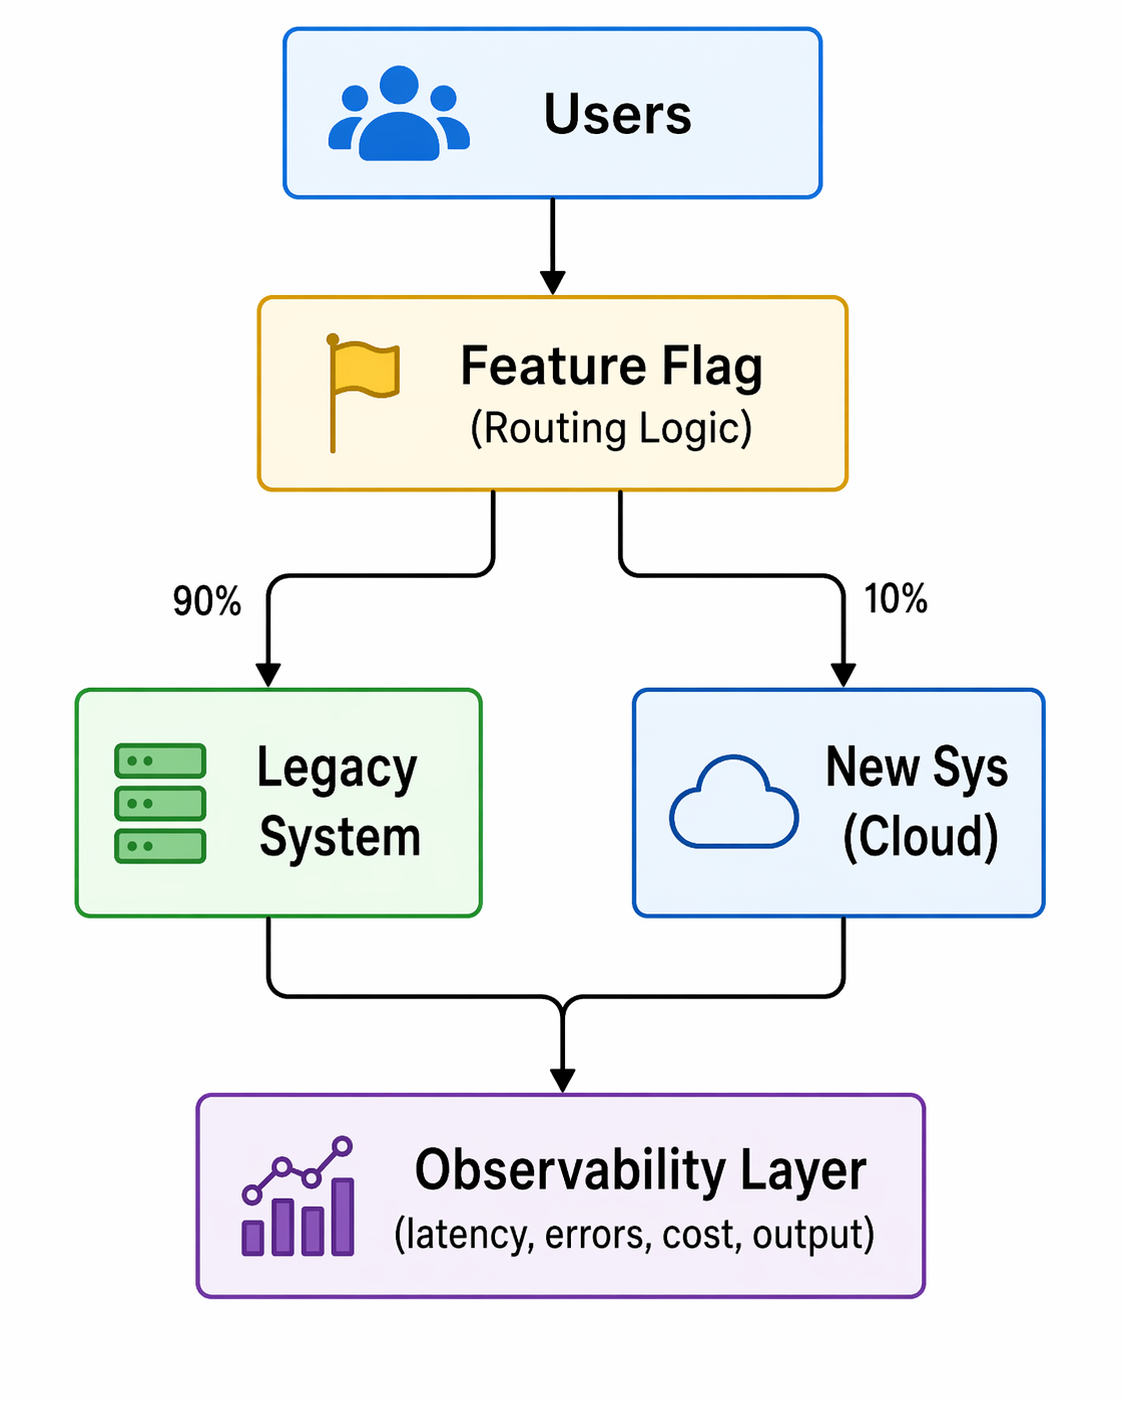
When you toggle a feature flag, you're changing the behavior of your application; sometimes, in subtle ways that are hard to detect through logs or metrics alone. By adding feature flag attributes directly to spans, you can make these changes observable at the trace level. This enables you to correlate performance, errors, or unusual behavior with the exact flag treatment a user received.
In practice, adding feature flag attributes to your spans allows faster debugging, clearer insights, and more confidence when rolling out flags in production. As teams ship code faster than ever, often with the help of AI, feature flags have become a primary tactic for controlling risk in production. However, when something goes wrong, it’s not enough to know that a request was slow or errored; you need to know which feature flag configuration caused the issue.
Without surfacing feature flag context in traces, teams are left to guess which rollout, experiment, or configuration change affected the behavior. Adding feature flag treatments directly to spans closes this gap by making flag-driven behavior observable, debuggable, and auditable in real time.
Enhancing Observability with Feature Flags and OpenTelemetry
If you’re already using OpenTelemetry, you may want to understand how to surface feature flag behavior in your traces. This article walks you through one approach to achieving this: manually enriching spans with feature flag attributes, allowing you to query traces based on specific flag states.
While this isn’t a native Harness FME integration, you can apply a simple pattern in your own applications to improve observability:
- Identify the spans in your code where feature flag behavior impacts execution. This could be a request handler, a background job, or any logical unit of work.
- Start a span (or use an existing one) for that unit of work using your OpenTelemetry tracer.
- Retrieve the relevant feature flag treatments for the context (for example, a user ID or session).
- Add each flag treatment as a span attribute so your traces can capture the state of feature flags during execution.
- Use these attributes in your observability platform (e.g., Honeycomb) to filter or query traces by flag state.
This approach requires adding feature flag treatments as span attributes in your application code. Feature flags are not automatically exported to OpenTelemetry in Harness FME.
For this demonstration, we will use Honeycomb’s Java Agent and a small sample application (a threaded echo server) to show how feature flag treatments can be added to spans for improved visibility. While this example uses Java, this pattern is language-agnostic and can be applied in any application that supports OpenTelemetry. The same steps apply to web services, background jobs, or any application logic where you want to track the impact of feature flags.
Prerequisites
Before you begin, ensure you have the following requirements:
- Java installed (v11 or later)
- A working local development environment
- Basic familiarity with Java sockets and threads
- Permission to bind to local ports (the sample server listens on port 5009)
Setup
Follow these instructions to prepare your workspace for running the sample threaded echo server:
- Create a working directory for your project by running the following command:
mkdir threaded-echo-server && cd threaded-echo-server. - Add your Java files module (for example, `ThreadedEchoServer.java` and `ClientHandler.java`).
- Compile the server by running the following command:
javac ThreadedEchoServer.java. - Run the server with
java ThreadedEchoServer.
How the Threaded Echo Server works
To illustrate this approach, we’ll use a small Java example: a threaded socket server that listens on port 5009 and echoes back whatever text the client sends.
The example below introduces a simple Java-based Threaded Echo Server. This server acts as our testbed for adding flag-aware span instrumentation.
When the feature flag next_step is on, the server sleeps for two seconds. The sleep is wrapped with a span named "next_step" / "span2". When the flag is off, the server executes the normal doSomeWork behavior without the added wait time.
This produces the visible difference in performance shown by OpenTelemetry in the chart below. With the flag turned on, the spans appear in your Honeycomb trace.

In this trace, the client sends four words. Each word shows nearly two seconds of processing time, which is the exact duration introduced by the feature flag.
With the flag turned off, the resulting trace shows the normal, faster echo processing flow:

The feature flag impacts the trace in two ways:
- A new nested span appears, named after the feature flag. These green bars displayed in each span show how the flag creates explicit instrumented regions within a single client session.
- Two seconds of artificial latency make the spans easy to identify.
Adding Feature Flag Treatments to Spans
So far, we’ve seen that feature flags can create additional spans in a trace. We can take this a step further: making the flags themselves queryable by adding their treatments as attributes to the top-level span. This lets you filter and analyze traces based on flag behavior.
The example below shows how the server evaluates its feature flags and attaches each treatment to the root echo span.
The program evaluates three feature flags: next_step, multivariant_demo, and new_onboarding. Using Harness FME, all flags are evaluated up front and stored in a flag2treatments map. Any dynamic changes to a flag during execution are ignored for the remainder of the program's run; however, there are ways to handle this in more advanced scenarios.
For this example, caching the treatments is fine, and each treatment is also added as a span attribute. By including the flag “impression” in the span, you can query traces to see which sessions were affected by a particular flag or treatment. This makes it easier to isolate and analyze trace behavior driven by specific feature flags.

In Honeycomb, you can query traces by feature flag “impressions” by setting COUNT in the Visualize section and adding split.next_step = on in the Where section (using AND if you have multiple conditions).
Next Steps for Feature Flag Observability
Feature flags aren’t ideal candidates for bytecode instrumentation. The challenge here isn’t in the SDK itself, but rather in determining what behavior you want to observe when a flag is toggled on or off.
Looking ahead, one possible approach is to treat spans as proxies for flags: a span could represent a flag, allowing you to enable or disable entire sections of live application code by identifying the associated spans. While conceptually powerful, this approach can be complex and may not scale well, depending on the number of spans your application uses.
In the short term, a simpler pattern works well: manually wrap feature flag changes with a span and add the flag treatments as span attributes. This provides you with visibility, powered by OpenTelemetry, into how feature flags impact your application's behavior, enabling better traceability and faster debugging.
To get started with feature flags, see the Harness FME Feature Management documentation. If you’re brand new to Harness FME, sign up for a free trial today.

.png)


.png)
_%20A%20Step-by-Step%20Guide.png)

.png)


.png)