Featured Blogs
.png)
Google's GKE Autopilot provides fully managed Kubernetes without the operational overhead of node management, security patches, or capacity planning. However, running chaos engineering experiments on Autopilot has been challenging due to its security restrictions.
We've solved that problem.
Why This Matters
Chaos engineering helps you identify issues before they impact your users. The approach involves intentionally introducing controlled failures to understand how your system responds. Think of it as a fire drill for your infrastructure.
GKE Autopilot secures clusters by restricting many permissions, which is excellent for security. However, this made running chaos experiments difficult. You couldn't simply deploy Harness Chaos Engineering and begin testing.
That changes today.
What Changed
We collaborated with Google to add Harness Chaos Engineering to GKE Autopilot's official allowlist. This integration enables Harness to run chaos experiments while operating entirely within Autopilot's security boundaries.
No workarounds required. Just chaos engineering that works as expected.
How to Set It Up
1. Apply the Allowlist
First, you need to tell GKE Autopilot that Harness chaos workloads are okay to run. Copy this command:
kubectl apply -f - <<'EOF'
apiVersion: auto.gke.io/v1
kind: AllowlistSynchronizer
metadata:
  name: harness-chaos-allowlist-synchronizer
spec:
  allowlistPaths:
  - Harness/allowlists/chaos/v1.62/*
  - Harness/allowlists/service-discovery/v0.42/*
EOF
Then wait for it to be ready:
kubectl wait --for=condition=Ready allowlistsynchronizer/harness-chaos-allowlist-synchronizer --timeout=60s
That's it for the cluster configuration.
2. Enable Autopilot Mode in Harness
Next, configure Harness to work with GKE Autopilot. You have several options:
If you're setting up chaos for the first time, just use the 1-click chaos setup and toggle on "Use static name for configmap and secret" during setup.
If you already have infrastructure configured, go to Chaos Engineering > Environments, find your infrastructure, and enable that same toggle.

You can also set this up when creating a new discovery agent, or update an existing one in Project Settings > Discovery.

What You Can Test
You can run most of the chaos experiments you'd expect:
The integration supports a comprehensive range of chaos experiments:
Resource stress: Pod CPU Hog, Pod Memory Hog, Pod IO Stress, Disk Fill. These experiments help you understand how your pods behave under resource constraints.
Network chaos: Pod Network Latency, Pod Network Loss, Pod Network Corruption, Pod Network Duplication, Pod Network Partition, Pod Network Rate Limit. Production networks experience imperfections, and your application needs to handle them gracefully.
DNS problems: Pod DNS Error to disrupt resolution, Pod DNS Spoof to redirect traffic.
HTTP faults: Pod HTTP Latency, Pod HTTP Modify Body, Pod HTTP Modify Header, Pod HTTP Reset Peer, Pod HTTP Status Code. These experiments test how your APIs respond to unexpected behavior.
API-level chaos: Pod API Block, Pod API Latency, Pod API Modify Body, Pod API Modify Header, Pod API Status Code. Good for testing service mesh and gateway behavior.
File system chaos: Pod IO Attribute Override, Pod IO Error, Pod IO Latency, Pod IO Mistake. These experiments reveal how your application handles storage issues.
Container lifecycle: Container Kill and Pod Delete to test recovery. Pod Autoscaler to see if scaling works under pressure.
JVM chaos if you're running Java: Pod JVM CPU Stress, Pod JVM Method Exception, Pod JVM Method Latency, Pod JVM Modify Return, Pod JVM Trigger GC.
Database chaos for Java apps: Pod JVM SQL Exception, Pod JVM SQL Latency, Pod JVM Mongo Exception, Pod JVM Mongo Latency, Pod JVM Solace Exception, Pod JVM Solace Latency.
Cache problems: Redis Cache Expire, Redis Cache Limit, Redis Cache Penetration.
Time manipulation: Time Chaos to introduce controlled time offsets.
What This Means for You
If you're running GKE Autopilot and want to implement chaos engineering with Harness, you can now do both without compromise. There's no need to choose between Google's managed experience and resilience testing.
For teams new to chaos engineering, Autopilot provides an ideal starting point. The managed environment reduces infrastructure complexity, allowing you to focus on understanding application behavior under stress.
Getting Started
Start with a simple CPU stress test. Select a non-critical pod and run a low-intensity Pod CPU Hog experiment in Harness. Observe the results: Does your application degrade gracefully? Do your alerts trigger as expected? Does it recover when the experiment completes?
Start small, understand your system's behavior, then explore more complex scenarios.
You can configure Service Discovery to visualize your services in Application Maps, add probes to validate resilience during experiments, and progressively explore more sophisticated fault injection scenarios.
Check out the documentation for the complete setup guide and all supported experiments.
The goal of chaos engineering isn't to break things. It's to understand what breaks before it impacts your users.
Latest Blogs

An Introduction to Disaster Recovery Testing: What You Need to Know in 2026
Businesses today run on computers, cloud systems, and digital tools. One big failure can stop everything. A cyber attack, a power outage, or a software glitch can shut down operations for hours or days. Disaster recovery testing is how you prove you can restore critical services when the unexpected happens.
In 2026, with hybrid and multi-cloud estates, distributed data, and tighter oversight, this is not a once-a-year fire drill. It is a continuous discipline that validates plans, uncovers weak links before they cause outages, and gives leaders confidence that customer-facing and internal systems can bounce back on demand.
Disaster recovery testing is a simple way to practice getting your systems back online after something goes wrong. It checks if your backup plans actually work before a real problem hits. This blog gives you a clear, step-by-step look at what it is, why it is essential right now, and how to get started.
What Is Disaster Recovery Testing?
Disaster recovery testing is a structured way to confirm that systems, data, and services can be restored to meet defined recovery goals after a disruption. The mandate is simple: verify that recovery works as designed and within the time and data loss thresholds the business requires. Effective programs test more than technology. They exercise people, processes, communications, and third-party dependencies end to end. The goal is to prove you can bring back data, apps, and services quickly with little loss.
A strong disaster recovery test plan typically covers:
- Clear recovery time objectives (RTOs) and recovery point objectives (RPOs) for each application tier.
- A current asset and application inventory with criticality tiers and upstream/downstream dependencies.
- Documented runbooks and playbooks for failover and failback, including decision criteria.
- Data protection strategies such as backups, replication, and snapshots with defined retention and immutability.
- Communication plans for internal teams, executives, customers, and partners.
- Roles and responsibilities, escalation paths, and an incident command structure.
- Third-party and vendor recovery commitments, service level agreements, and contact procedures.
- Metrics, governance, and reporting for audits and continuous improvement.
Without regular tests, even the best plan stays unproven. Many companies learn this the hard way when an outage lasts longer than expected.
Types of Disaster Recovery Tests
Different systems require different levels of validation based on their criticality, risk, and business impact. A layered testing strategy helps teams build confidence gradually starting with low-risk discussions and moving toward full-scale failovers.
By combining multiple types of tests, organizations can validate both technical recovery and team readiness without unnecessary disruption.
Tabletop Exercises:
Tabletop exercises are discussion-based sessions where stakeholders walk through a hypothetical disaster scenario step by step. These are typically the starting point for any disaster recovery program, as they help clarify roles, responsibilities, and decision-making processes. While they do not involve actual system changes, they are highly effective in identifying communication gaps and aligning teams on escalation paths.
Simulations:
Simulations introduce more realism by creating scenario-driven drills with staged alerts and mocked dependencies. Teams respond as if a real incident is happening, but without impacting production systems. This type of testing is useful for validating how teams react under pressure and ensuring that tools, alerts, and workflows function as expected in a controlled environment.
Operational Walkthroughs:
Operational walkthroughs involve executing recovery runbooks step by step to verify that all prerequisites such as permissions, tooling, and sequencing are in place. These tests are more hands-on than simulations and are often conducted before attempting partial or full failovers. They help reduce surprises by ensuring that recovery procedures are practical and executable.
Partial Failovers:
Partial failovers test the recovery of specific services, components, or regions, usually during off-peak hours. This approach allows teams to validate critical dependencies and recovery workflows without risking the entire system. It is especially useful for building confidence in complex environments where a full failover may be too risky or costly to perform frequently.
Full Failovers:
Full failovers are the most comprehensive form of disaster recovery testing, where production systems are completely switched to a secondary site or region. After validation, systems are failed back to the primary environment. These tests provide the strongest proof of resilience, as they validate end-to-end recovery, including performance and data integrity, but they require careful planning due to their potential impact.
Automated Validations:
Automated validations use codified workflows or pipelines to continuously test recovery processes. These tests can automatically spin up recovery environments, validate configurations, and run health checks. They are ideal for frequent, low-risk testing and help reduce human error while providing fast and consistent feedback. Over time, automation becomes a key driver for maintaining continuous assurance in disaster recovery readiness.
Here’s the table outlines the primary types of disaster recovery testing and where they fit.

If you are building a disaster recovery testing checklist, include a mix of these types of disaster recovery testing and map each to the systems they protect. Over time, increase the frequency of automated validations and reserve full failovers for the highest-value services.
Why Disaster Recovery Testing Matters in 2026
The world is more connected than ever. Companies rely on cloud services, remote teams, and AI tools. At the same time, threats keep growing. Cyber attacks like ransomware are more common. Natural events and supply chain problems add extra risk. Cloud systems can fail without warning.
Recent studies show the cost of downtime keeps rising. For many large companies, one hour of downtime can cost more than 300,000 dollars. Some industries see losses climb into the millions per hour. Smaller businesses lose thousands per minute in lost sales and unhappy customers.
In 2026, experts note that most organizations still test their recovery plans only once or twice a year. That is not enough. Systems change fast. New software updates, new cloud setups, and new team members can break old plans.
Regular testing gives you confidence. It cuts recovery time and protects revenue. It also helps meet rules from banks, healthcare groups, and government agencies that require proof of preparedness.
How Modern Tools Make Disaster Recovery Testing Easier
Traditional testing took weeks of manual work. Today, platforms combine different testing methods in one place. This approach saves time and gives better results.
For example, Harness recently released its Resilience Testing module. It brings together chaos testing (to inject real-world failures safely), load testing (to check performance under stress), and disaster recovery testing. You can run everything inside your existing pipelines. This means you can test recovery steps automatically, validate failovers, and spot risks early.
Teams using this kind of integrated platform report faster recovery times and fewer surprises. It fits right into daily development work instead of feeling like an extra project.
The Role of AI in Disaster Recovery Testing
Artificial intelligence is making disaster recovery testing much smarter in 2026. It turns testing from a once-a-year chore into something fast, ongoing, and more accurate.
AI helps teams spot problems early by analyzing system data and predicting where failures might happen, allowing issues to be fixed before they cause real damage. It also enables continuous and automated testing, running scenarios in the background without interrupting normal business operations. Instead of manually creating test plans, AI can generate and recommend the most relevant scenarios based on your actual system setup, saving time and improving coverage.
Another major advantage is how quickly AI can analyze results. It processes test outcomes in real time and clearly points out what needs to be fixed, removing the guesswork. Over time, it learns from every test run and continuously improves your disaster recovery strategy, making it more reliable with each iteration.
Overall, AI helps teams recover faster and with fewer mistakes. Rather than relying on assumptions, teams get clear, data-driven insights to strengthen their systems. Tools like the Resilience Testing module from Harness already bring these capabilities into practice by combining chaos testing, load testing, and disaster recovery testing. With AI built into the platform, it can recommend the right tests, automate execution, and provide simple, actionable steps to improve system resilience.
Conclusion
Disaster recovery testing is not a one-time task. It is an ongoing habit that protects your business in 2026 and beyond. The companies that test regularly recover faster, lose less money, and keep customer trust.
Take a moment now to review your current plan. Pick one critical system and schedule a simple test this quarter. If you want a modern way to make the process simple and powerful, look at solutions like the Resilience Testing module from Harness. It helps you combine multiple testing types and use AI so you stay ready no matter what comes next.
Your business depends on technology. Make sure that technology can bounce back when it counts. Start testing today and build the confidence your team needs for whatever 2026 brings.

Why DR Testing Can No Longer Be an Afterthought
Resilience Is Not a Feature — It Is a Business Imperative
In today's digital economy, every organisation's revenue, reputation, and customer trust is inextricably linked to the uptime of its cloud-based services. From banking and payments to logistics and healthcare, a cloud outage is no longer just an IT problem — it is a business crisis. Despite this reality, Disaster Recovery (DR) testing remains one of the most neglected disciplines in enterprise technology operations.
Most organisations have a DR plan. Far fewer test it regularly. And even fewer have the tools to simulate realistic failure scenarios with the confidence needed to validate that their recovery objectives — Recovery Time Objectives (RTO) and Recovery Point Objectives (RPO) — are actually achievable when it matters most.
A DR plan that has never been tested is not a plan — it is a hypothesis. And in the event of a real disaster, a hypothesis is not good enough.
The question is no longer whether disasters will happen to cloud infrastructure. The question is whether your organisation is prepared to survive them — and emerge with your business services intact.
A New Era of Risk: When War Comes to the Cloud
March 1, 2026 — A Watershed Moment for the Cloud Industry
On March 1, 2026, something unprecedented happened: physical warfare directly struck hyperscale cloud infrastructure. Drone strikes — part of Iran's retaliatory campaign following the joint U.S.-Israeli Operation Epic Fury — hit three Amazon Web Services (AWS) data centers in the United Arab Emirates and Bahrain. It marked, according to the Uptime Institute, the first confirmed military attack on a hyperscale cloud provider in history.
AWS confirmed that two facilities in the UAE were directly struck in the ME-CENTRAL-1 region, while a third in Bahrain sustained damage from a nearby strike. The attacks caused structural damage, disrupted power delivery, and triggered fire suppression systems that produced additional water damage to critical equipment. Two of the three availability zones in the UAE region were knocked offline simultaneously — a scenario that defeated standard redundancy models designed for hardware failures and natural disasters, not military strikes.
"Teams are working around the clock on availability." — AWS CEO Matt Garman, speaking to CNBC on the drone strike impacts.
The Ripple Effect: From Data Centers to Digital Services
The cascading business impact was immediate and wide-ranging. Ride-hailing and delivery platform Careem went dark. Payments companies Alaan and Hubpay reported their apps going offline. UAE banking giants — Emirates NBD, First Abu Dhabi Bank, and Abu Dhabi Commercial Bank — reported service disruptions to customers. Enterprise data company Snowflake attributed elevated error rates in the region directly to the AWS outage. Investing platform Sarwa was also impacted.
AWS subsequently urged all affected customers to activate their disaster recovery plans and migrate workloads to other AWS regions. For many organisations, that recommendation revealed an uncomfortable truth: they had workloads running in a conflict zone without knowing it, and they had DR plans that had never been meaningfully tested.
The event was not merely a localised incident. It sent shockwaves through global financial markets, triggered fresh concerns about cloud infrastructure security, and forced technology and business leaders worldwide to confront a question they had been deferring: are we actually prepared for a regional cloud failure?
The Uncomfortable Truth About Cloud Dependency
AWS is, by any measure, the world's most reliable cloud platform. With a global network of regions, availability zones, and decades of engineering investment in fault tolerance, it represents the gold standard of cloud infrastructure. And yet — disasters still happen.
The Middle East drone strikes illustrate a new class of risk that sits entirely outside the traditional taxonomy of cloud failure modes. Hardware faults, software bugs, network misconfigurations, and even natural disasters are all scenarios that cloud providers engineer against. But a sustained, multi-facility military attack that simultaneously disables multiple availability zones in a region is a different beast entirely.
Even the most reliable cloud provider cannot guarantee immunity from geopolitical events, physical infrastructure attacks, or large-scale regional disruptions. DR planning must account for the full spectrum of failure scenarios.
For enterprises that depended on AWS's Middle East regions — whether knowingly for local operations or unknowingly through traffic routing — the incident transformed abstract geopolitical risk into an immediate operational reality. Financial institutions could not process transactions. Customers could not access banking apps. Businesses that had single-region deployments had no failover path.
The lesson is not to distrust AWS or any cloud provider. It is to accept that no infrastructure, however well-engineered, is beyond the reach of catastrophic failure. Disaster Recovery planning is not a reflection of distrust in your cloud provider — it is a reflection of maturity in your own risk management.
And if DR planning is the strategy, DR testing is the discipline that gives you confidence the strategy will actually work.
The Case for Regular, Rigorous DR Testing
Disaster recovery has historically been treated as a compliance checkbox. Organisations document a DR plan, conduct an annual tabletop exercise, and file it away until the next audit. The problem with this approach is that it bears no resemblance to the actual experience of a regional cloud failure.
Real DR scenarios involve cascading failures, unexpected dependencies, human coordination under pressure, and recovery steps that take far longer in practice than on paper. RTO targets that look achievable in a spreadsheet often prove wildly optimistic when an engineering team is scrambling to restore services during an actual outage.
Effective DR testing requires three things that most organisations lack:
- Realistic failure simulation: The ability to actually replicate the conditions of a regional cloud outage, not just talk through what might happen.
- End-to-end recovery validation: A structured workflow that tests not just failover, but the complete path from disaster simulation through recovery confirmation.
- Repeatable, frequent execution: DR tests should not be annual events. In a world where geopolitical risk is rising and infrastructure attacks are a documented reality, quarterly or even monthly DR validation is increasingly necessary.
However, there is a fundamental challenge that has historically limited the frequency and quality of DR testing: creating a realistic disaster scenario — such as a full region failure — in a production cloud environment is extremely complex, risky, and operationally demanding. Getting it wrong can itself cause the very outage you are preparing for.
This is precisely where purpose-built DR testing tooling becomes essential.
Enter Harness Resilience Testing: DR Testing Without the Drama
Harness has long been a leader in the chaos engineering and software delivery space. With the evolution of its platform to Harness Resilience Testing, the company has now brought together chaos engineering, load testing, and disaster recovery testing under a single, unified module — purpose-built for the kind of comprehensive resilience validation that modern organisations need.
Simulating Region Failure — Safely and Repeatably
One of the most powerful capabilities within Harness Resilience Testing is the ability to simulate an AWS region failure. Rather than requiring engineering teams to manually orchestrate complex failure conditions — or worse, waiting for a real disaster to find out what happens — Harness provides a controlled simulation environment that replicates the conditions of a full regional outage.
This means organisations can observe exactly how their systems behave when, for example, the AWS ME-CENTRAL-1 region goes offline. Which services fail? How quickly do failover mechanisms activate? Are there hidden dependencies that were not accounted for in the DR plan? Does the recovery path actually meet the RTO and RPO targets?
Harness Resilience Testing enables organisations to simulate AWS region failure scenarios in multiple ways (AZ blackhole, Bulk Node shutdows or coordinated VPC misconfigurations etc — giving engineering teams the ability to experience and validate their DR response before a real disaster strikes.
End-to-End DR Test Workflow: From Disaster to Recovery
What distinguishes Harness Resilience Testing from point solutions is its comprehensive, end-to-end DR Test workflow. The platform does not just simulate failure — it orchestrates the entire DR testing lifecycle:
- Disaster Simulation: Harness injects failure conditions that replicate real-world scenarios — including region-level AWS outages — in a controlled, configurable manner.
- Recovery Validation: The platform then validates that recovery procedures execute correctly, services restore within defined objectives, and the system reaches a healthy state.
- Observability and Reporting: Harness captures detailed metrics, failure indicators, and recovery timelines — giving teams the data they need to identify gaps and continuously improve their DR posture.
This end-to-end approach transforms DR testing from a manually intensive, high-risk activity into a structured, repeatable, and automatable workflow — one that can be run as frequently as the business requires.
Harness Resilience Testing provides DR workflows for region failures
Harness Resilience Test module provides the required chaos steps that can be pulled into the DR Test workflow to introduce a region failure.
.png)
Follow the DR test documentation here to understand how to get started with DR Test workflows.
Conclusion: Make DR Testing a Continuous Practice, Not an Annual Event
The drone strikes on AWS data centers in the Middle East on March 1, 2026 were a stark reminder that the risks facing cloud infrastructure are no longer theoretical. Geopolitical events, physical attacks, and unprecedented failure scenarios are now part of the operational reality that technology leaders must plan for — and test against.
AWS remains one of the most reliable, battle-tested cloud platforms on the planet. But reliability does not mean immunity. Even the best-engineered infrastructure can be overwhelmed by events outside its design parameters. That is not a weakness of AWS — it is a fundamental truth about the physical world in which all digital infrastructure ultimately exists.
Organisations that depend on AWS — for regional workloads, global operations, or anywhere in between — need to take a hard look at their DR readiness. Not just whether they have a plan, but whether that plan has been tested, validated, and proven to work under realistic failure conditions.
Harness Resilience Testing makes it straightforward to simulate AWS region failures and execute comprehensive end-to-end DR tests — enabling organisations to validate their recovery posture with confidence, at a frequency that matches the pace of modern risk.
With Harness, DR testing for AWS region failures is no longer a complex, resource-intensive undertaking reserved for annual compliance exercises. It becomes an efficient, repeatable, and continuously improving practice — one that can be integrated into regular engineering workflows and scaled to meet the demands of an increasingly unpredictable world.
The organisations that will emerge strongest from the next regional cloud disaster are not the ones with the best DR documents. They are the ones that have already run the test — and know exactly what to do when the alert fires.
With Harness Resilience Testing, that organisation can be yours. Book a demo with our team to explore more.
.png)
An Introduction to Disaster Recovery Testing: What You Need to Know in 2026
Businesses today run on computers, cloud systems, and digital tools. One big failure can stop everything. A cyber attack, a power outage, or a software glitch can shut down operations for hours or days. Disaster recovery testing is how you prove you can restore critical services when the unexpected happens.
In 2026, with hybrid and multi-cloud estates, distributed data, and tighter oversight, this is not a once-a-year fire drill. It is a continuous discipline that validates plans, uncovers weak links before they cause outages, and gives leaders confidence that customer-facing and internal systems can bounce back on demand.
Disaster recovery testing is a simple way to practice getting your systems back online after something goes wrong. It checks if your backup plans actually work before a real problem hits. This blog gives you a clear, step-by-step look at what it is, why it is essential right now, and how to get started.
What Is Disaster Recovery Testing?
Disaster recovery testing is a structured way to confirm that systems, data, and services can be restored to meet defined recovery goals after a disruption. The mandate is simple: verify that recovery works as designed and within the time and data loss thresholds the business requires. Effective programs test more than technology. They exercise people, processes, communications, and third-party dependencies end to end. The goal is to prove you can bring back data, apps, and services quickly with little loss.
A strong disaster recovery test plan typically covers:
- Clear recovery time objectives (RTOs) and recovery point objectives (RPOs) for each application tier.
- A current asset and application inventory with criticality tiers and upstream/downstream dependencies.
- Documented runbooks and playbooks for failover and failback, including decision criteria.
- Data protection strategies such as backups, replication, and snapshots with defined retention and immutability.
- Communication plans for internal teams, executives, customers, and partners.
- Roles and responsibilities, escalation paths, and an incident command structure.
- Third-party and vendor recovery commitments, service level agreements, and contact procedures.
- Metrics, governance, and reporting for audits and continuous improvement.
Without regular tests, even the best plan stays unproven. Many companies learn this the hard way when an outage lasts longer than expected.
Types of Disaster Recovery Tests
Different systems require different levels of validation based on their criticality, risk, and business impact. A layered testing strategy helps teams build confidence gradually starting with low-risk discussions and moving toward full-scale failovers.
By combining multiple types of tests, organizations can validate both technical recovery and team readiness without unnecessary disruption.
Tabletop Exercises:
Tabletop exercises are discussion-based sessions where stakeholders walk through a hypothetical disaster scenario step by step. These are typically the starting point for any disaster recovery program, as they help clarify roles, responsibilities, and decision-making processes. While they do not involve actual system changes, they are highly effective in identifying communication gaps and aligning teams on escalation paths.
Simulations:
Simulations introduce more realism by creating scenario-driven drills with staged alerts and mocked dependencies. Teams respond as if a real incident is happening, but without impacting production systems. This type of testing is useful for validating how teams react under pressure and ensuring that tools, alerts, and workflows function as expected in a controlled environment.
Operational Walkthroughs:
Operational walkthroughs involve executing recovery runbooks step by step to verify that all prerequisites such as permissions, tooling, and sequencing are in place. These tests are more hands-on than simulations and are often conducted before attempting partial or full failovers. They help reduce surprises by ensuring that recovery procedures are practical and executable.
Partial Failovers:
Partial failovers test the recovery of specific services, components, or regions, usually during off-peak hours. This approach allows teams to validate critical dependencies and recovery workflows without risking the entire system. It is especially useful for building confidence in complex environments where a full failover may be too risky or costly to perform frequently.
Full Failovers:
Full failovers are the most comprehensive form of disaster recovery testing, where production systems are completely switched to a secondary site or region. After validation, systems are failed back to the primary environment. These tests provide the strongest proof of resilience, as they validate end-to-end recovery, including performance and data integrity, but they require careful planning due to their potential impact.
Automated Validations:
Automated validations use codified workflows or pipelines to continuously test recovery processes. These tests can automatically spin up recovery environments, validate configurations, and run health checks. They are ideal for frequent, low-risk testing and help reduce human error while providing fast and consistent feedback. Over time, automation becomes a key driver for maintaining continuous assurance in disaster recovery readiness.
Here’s the table outlines the primary types of disaster recovery testing and where they fit.

If you are building a disaster recovery testing checklist, include a mix of these types of disaster recovery testing and map each to the systems they protect. Over time, increase the frequency of automated validations and reserve full failovers for the highest-value services.
Why Disaster Recovery Testing Matters More in 2026
The world is more connected than ever. Companies rely on cloud services, remote teams, and AI tools. At the same time, threats keep growing. Cyber attacks like ransomware are more common. Natural events and supply chain problems add extra risk. Cloud systems can fail without warning.
Recent studies show the cost of downtime keeps rising. For many large companies, one hour of downtime can cost more than 300,000 dollars. Some industries see losses climb into the millions per hour. Smaller businesses lose thousands per minute in lost sales and unhappy customers.
In 2026, experts note that most organizations still test their recovery plans only once or twice a year. That is not enough. Systems change fast. New software updates, new cloud setups, and new team members can break old plans.
Regular testing gives you confidence. It cuts recovery time and protects revenue. It also helps meet rules from banks, healthcare groups, and government agencies that require proof of preparedness.
How Modern Tools Make Disaster Recovery Testing Easier
Traditional testing took weeks of manual work. Today, platforms combine different testing methods in one place. This approach saves time and gives better results.
For example, Harness recently released its Resilience Testing module. It brings together chaos testing (to inject real-world failures safely), load testing (to check performance under stress), and disaster recovery testing. You run everything inside your existing pipelines. This means you can test recovery steps automatically, validate failovers, and spot risks early.
Teams using this kind of integrated platform report faster recovery times and fewer surprises. It fits right into daily development work instead of feeling like an extra project.
The Role of AI in Disaster Recovery Testing
Artificial intelligence is making disaster recovery testing much smarter in 2026. It turns testing from a once-a-year chore into something fast, ongoing, and more accurate.
AI helps teams spot problems early by analyzing system data and predicting where failures might happen, allowing issues to be fixed before they cause real damage. It also enables continuous and automated testing, running scenarios in the background without interrupting normal business operations. Instead of manually creating test plans, AI can generate and recommend the most relevant scenarios based on your actual system setup, saving time and improving coverage.
Another major advantage is how quickly AI can analyze results. It processes test outcomes in real time and clearly points out what needs to be fixed, removing the guesswork. Over time, it learns from every test run and continuously improves your disaster recovery strategy, making it more reliable with each iteration.
Overall, AI helps teams recover faster and with fewer mistakes. Rather than relying on assumptions, teams get clear, data-driven insights to strengthen their systems. Tools like the Resilience Testing module from Harness already bring these capabilities into practice by combining chaos testing, load testing, and disaster recovery testing. With AI built into the platform, it can recommend the right tests, automate execution, and provide simple, actionable steps to improve system resilience.
Conclusion
Disaster recovery testing is not a one-time task. It is an ongoing habit that protects your business in 2026 and beyond. The companies that test regularly recover faster, lose less money, and keep customer trust.
Take a moment now to review your current plan. Pick one critical system and schedule a simple test this quarter. If you want a modern way to make the process simple and powerful, look at solutions like the Resilience Testing module from Harness. It helps you combine multiple testing types and use AI so you stay ready no matter what comes next.
Your business depends on technology. Make sure that technology can bounce back when it counts. Start testing today and build the confidence your team needs for whatever 2026 brings.

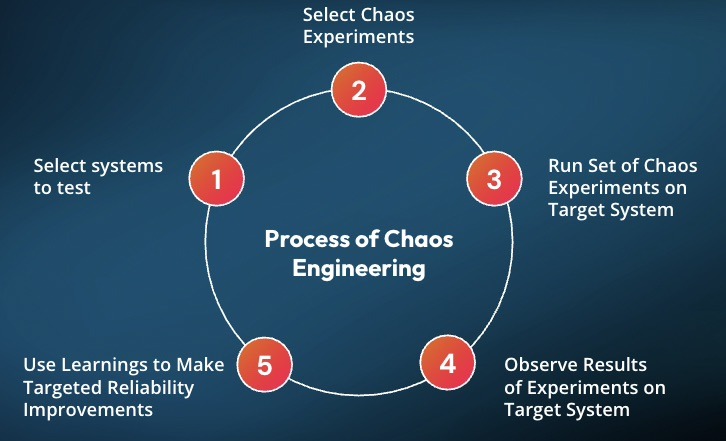
From Chaos to Confidence: Debunking the 3 Biggest Myths of Chaos Engineering
Many organizations hesitate to adopt chaos engineering because of persistent misconceptions that make it seem reckless or reserved for tech giants.
But the reality is far more practical and far more accessible.
Drawing from experience building the chaos engineering program at Target.com, Matt Schillerstrom breaks down the three biggest myths holding teams back and what is actually true.
Myth 1: Chaos Engineering Means Random Failure
The fear is understandable. Engineers unplugging servers, triggering outages, and hoping for the best.
The Reality: Chaos engineering is not random. It is disciplined, which helps teams build trust and confidence in their systems.
It is built on hypothesis-driven experimentation. Every test starts with a clear expectation: what should happen if this component fails?
Instead of breaking things randomly, teams run controlled experiments. For example, stopping one out of ten servers to observe how the system adapts. These scenarios are planned, reviewed, and executed with intention.
At Target, when Matt was working with engineering teams, they would learn something before running a test by getting the whole team aligned on the experiment's hypothesis. It would require teams to review their architecture diagrams, documentation, and runbooks, often revealing issues before a test was started.
The goal is not disruption. The goal is learning.
Today, teams are taking this further with AI, automatically identifying resilience risks and generating experiments before issues reach production.
Read how this works in practice: AI-Powered Resilience Testing with Harness MCP Server and Windsurf
Myth 2: It’s Only for FAANG Companies
Chaos engineering is often associated with Netflix, Google, and other hyperscalers. That makes it feel out of reach.
The Reality: You do not need massive scale to get meaningful value.
You can start small today.
A simple experiment, such as increasing memory utilization on a single service, can reveal whether your auto-scaling actually works. These small tests validate that the resilience mechanisms you are using will function when issues happen, rather than having your customers impacted.
What matters is not scale. What matters is consistency and learning how your system behaves under stress.
Myth 3: Chaos Engineering Replaces Traditional Testing
Some teams worry that adopting chaos engineering means replacing QA or existing testing workflows.
The Reality: Chaos engineering strengthens what you already do.
At Target, chaos experiments were layered into monthly load testing. While simulating peak traffic, failure scenarios such as payment authorization latency were introduced to observe system behavior under real pressure.
This approach does not replace testing. It makes it more realistic and more valuable.
Build Confidence, Not Chaos
Chaos engineering is not about breaking systems. It is about understanding them.
When teams move from ad hoc testing to small, continuous, hypothesis-driven experiments, they gain something far more valuable than test results. They gain confidence.
Confidence that their systems will behave as expected.
Confidence that failures will not become outages.
Confidence that they are ready for the unexpected.
See It in Action
If you are thinking about chaos engineering, the best way to understand it is to start.
Harness helps teams safely design, run, and learn from controlled chaos experiments without putting production at risk.
Want to try your first chaos engineering test? Sign up for your free Resilience Testing account today. Prefer a hands-on demo with an expert? Click here for a personalized demo.

Load Testing: An Essential Guide for 2026
In today's always-on digital economy, a single slow page or unexpected crash during peak traffic can cost businesses thousands or even millions of dollars in lost revenue, damaged reputation, and frustrated customers. Imagine Black Friday shoppers abandoning carts because your e-commerce site buckles under load, or a SaaS platform going down during a major product launch. This is where load testing becomes non-negotiable.
Load testing simulates real-world user traffic to ensure your applications, websites, and APIs stay fast, stable, and scalable. It's a cornerstone of performance testing that helps teams catch bottlenecks early, validate SLAs, and build resilient systems.
If you're searching for a complete load testing guide, what is load testing, or how to perform load testing, you're in the right place. This beginner-friendly introduction covers everything from the basics to best practices, with practical steps anyone can follow.
What Is Load Testing?
Load testing is a type of performance testing that evaluates how your system behaves under expected (and sometimes peak) user loads. It simulates concurrent users, requests, or transactions to measure key metrics such as Response times (average, p95, p99), Throughput (requests per second), Error rates, Resource utilization (CPU, memory, database connections), Latency and scalability.
Unlike unit or functional tests that check "does it work?", load testing answers: "How does it perform when 1,000 (or 100,000) people use it at once?"
Done early and often, load testing reduces risk across the lifecycle. It confirms capacity assumptions, reveals infrastructure limits, and proves that recent changes haven’t slowed critical paths. The result is fewer production incidents and fewer late-night fire drills.
Key terminology to anchor your approach:
- Response time: End-to-end time to complete a request.
- Latency: The network delay portion of response time.
- Throughput: Requests or transactions per second.
- Concurrency: The number of simultaneous users or sessions.
- Virtual users: Emulated users that generate traffic.
- Think time: Pauses between actions to mimic real behavior.
- Error rate: Percentage of requests that fail.
- Saturation point: Load level where performance drops sharply.
- Service-level objective (SLO): A target like p95 response time under 500 ms.
Why Load Testing Matters?
Effective load testing quantifies capacity, validates autoscaling, and uncovers issues like thread pool starvation, database contention, cache thrash, and third-party limits. With data in hand, you can tune connection pools, garbage collection, caching tiers, and CDN strategies so the app stays fast when it counts.
Skipping load testing is like launching a rocket without wind-tunnel tests, risky and expensive. Here's why it's essential:
- Prevents costly downtime: Unplanned outages average $5,600–$14,000+ per minute for enterprises, with some large companies facing $1M+ per hour.
- Improves user experience and conversions: Even 100ms of added latency can reduce sales by 1% and one-second delays can drop conversions by 7% for businesses.
- Validates scalability and auto-scaling: Especially critical for cloud-native apps on Kubernetes or AWS.
- Saves money long-term: Catch issues in staging instead of production; reduce infrastructure over-provisioning.
- Boosts confidence for high-traffic events: Product launches, sales, seasonal peaks.
Investing in load testing upfront keeps teams focused on building, not firefighting. Many major outages (think major retailers or banking apps) trace back to untested load scenarios. Load testing helps you ship with confidence.
Types of Load Testing
Not all traffic patterns are the same, and your system shouldn’t be tested with a one-size-fits-all approach. Different load testing scenarios help you understand how your application behaves under various real-world conditions, from everyday usage to extreme, unpredictable events.
- Baseline testing - This scenario tests your system under normal, expected load conditions. It helps establish a performance benchmark so you can compare how the system behaves under higher stress levels later.
- Ramp-up / Steady-state testing - In this approach, the load is gradually increased until it reaches a peak and is then maintained for a period of time. This helps you observe how your system handles growth in traffic and whether it can sustain peak load consistently.
- Stress testing - In this type of testing you push a system beyond its limits to see what happens when it starts to fail. In simple words, you keep increasing users or traffic until the system can’t handle it anymore.
- Spike testing - Spike testing simulates sudden and extreme increases in traffic over a short period. It is useful for understanding how your system reacts to unexpected surges, such as flash sales or viral events.
- Soak / Endurance testing - This type of testing runs the system under a steady load for an extended duration. It helps uncover issues like memory leaks, resource exhaustion, or performance degradation over time.
- Scalability testing: Validates scale-up and scale-out plans. Confirms that larger or additional instances deliver predictable gains and that autoscaling triggers map to realistic signals.
- Combined testing (Load + Chaos) - Here, load testing is combined with chaos engineering practices, such as injecting failures like network latency or pod crashes during high traffic. This helps evaluate how resilient your system is under both stress and failure conditions.
How to Perform Load Testing?
Load testing isn’t just about throwing traffic at your system, it’s about understanding how your application behaves under real-world conditions and uncovering hidden bottlenecks before your users do.
Here's a step-by-step guide to do load testing:
- Define objectives and scope - Start by clearly defining what success looks like for your system. Identify your SLAs, expected concurrent users, peak traffic events, and the most critical user journeys like login, checkout, or key API calls.
- Identify test scenarios -Use real production data such as analytics and logs to design realistic test scenarios. Make sure to include both common user flows (happy paths) and edge cases that could potentially break the system.
- Set up test environment- Create a test environment that closely mirrors production in terms of infrastructure, data volume, and network conditions.
- Create scripts - Develop scripts that simulate real user behavior using load testing tools. Incorporate think times, random delays, and varied actions to mimic how actual users interact with your system.
- Configure load profile - Define how the load will be applied, gradually ramp up users, maintain a steady load, and then ramp down. This helps you observe how the system behaves under increasing and sustained pressure.
- Execute the test - Run your tests in a controlled, non-production environment first to avoid impacting real users. Monitor system performance in real-time to catch any immediate issues.
- Analyze results - Dive into the results using logs, dashboards, and APM tools to identify performance bottlenecks. Focus on metrics like response time, error rates, and system throughput.
- Iterate and report - Fix the issues identified during testing and re-run tests to validate improvements. Document your findings and share insights with stakeholders for better decision-making.
- Integrate into CI/CD pipelines - Automate load testing by integrating it into your CI/CD pipelines. This ensures performance is continuously validated with every build or deployment.
Load testing is an iterative process, not a one-time activity. The more consistently you test and refine, the more resilient and reliable your system becomes over time.
Role of AI in load testing
Moving into 2026 and beyond, AI is shifting load testing from a manual, scheduled chore into an intelligent, autonomous process. Instead of relying on static scripts, AI agents now ingest vast streams of real-world data including recent incident reports, deployment logs, and even design changes documented in wikis to generate context-sensitive testing scenarios. This ensures that performance suites are no longer generic; they are hyper-targeted to the specific risks introduced by the latest code commits or environmental shifts, allowing teams to catch bottlenecks before they ever reach production.
The relationship between testing and infrastructure has also become a two-way street. Beyond just identifying breaking points, AI-driven analysis of load test results now provides proactive recommendations for deployment configurations. By correlating performance metrics with resource allocation, these systems can suggest the "golden path" for auto-scaling thresholds, memory limits, and container orchestration. This creates a continuous feedback loop where the load test doesn't just pass or fail it actively optimizes the production environment for peak efficiency.
Load testing for AI Agents
In the new landscape of AI agents proliferation, load testing is no longer just about hitting a server with traffic it's about managing the explosion of agentic orchestration. With organizations deploying hundreds of specialized AI agents, a single user request can trigger a "storm" of inter-agent communication, where one agent's output becomes another's prompt. Traditional load tests fail here because they can't predict these emergent behaviors or the cascading latency that occurs when multiple agents reason, call external APIs, and update shared memory simultaneously. Testing must now account for "prompt bloat" and context contamination, where excessive or conflicting data fed into these agent chains causes performance to degrade or costs to spike unexpectedly.
To survive this complexity, performance engineering in 2026 has shifted toward dynamic environment testing and automated "prompt volume" estimation. Load testers are now using tools like AI Gateways to monitor and rate-limit the massive volume of prompts moving between agents, ensuring that "reasoning loops" don't turn into infinite, resource-draining cycles. By simulating thousands of parallel agent trajectories in virtual sandboxes, teams can identify the specific point where a flurry of prompts causes an LLM's context window to "clash," leading to the 30–40% drops in accuracy often seen under heavy organizational load.
Popular Load Testing Tools
When selecting a load testing tool, teams often start with open-source options for flexibility and cost, then move to enterprise or cloud-managed solutions for scale, collaboration, and integrations.
Here are some of the most popular and widely used load testing tools in 2026:
- Open-source/free: Apache JMeter, k6 (Grafana), Gatling, Locust (Python-based).
- Enterprise: Harness, LoadRunner, NeoLoad, BlazeMeter, LoadNinja.
Choose based on scripting language, scale needs, and integration. For teams already invested in Locust or seeking to combine load testing with chaos engineering in CI/CD pipelines, platforms like Harness Resilience Testing provide seamless native support to elevate your testing strategy.
Load Testing Best Practices in 2026
As systems grow more distributed and user expectations continue to rise, load testing in 2026 is no longer optional, it’s a continuous discipline. Following the right best practices ensures that your application is not just fast, but also resilient and reliable under real-world conditions.
- Test early and often (shift-left) - Start load testing during the development phase instead of waiting until pre-release. This will help you to catch performance issues early when they are easier and cheaper to fix.
- Use realistic data and traffic models - Base your tests on actual production data, analytics, and user behavior patterns. This ensures your test scenarios closely reflect how users interact with your system in reality.
- Match production environments - Ensure your testing environment mirrors production as closely as possible in terms of configurations, data volume, and scaling policies. This improves the accuracy and reliability of your test results.
- Focus on user journeys - Instead of only testing raw request throughput, simulate complete user workflows like login, search, or checkout.
- Monitor golden signals - Track key performance indicators such as latency, traffic, error rates, and system saturation. These “golden signals” help you quickly identify and diagnose performance issues.
- Automate wisely - Keep smoke-level checks in CI to catch obvious regressions. Reserve heavier runs for staging or pre-production where you can mirror production closely.
- Combine with chaos engineering - Introduce controlled failures during load testing, such as network delays or service disruptions. This helps evaluate how well your system performs under both stress and failure conditions.
Adopting these best practices helps you move beyond basic performance testing toward building truly resilient systems. In 2026, it’s not just about handling traffic, it’s about thriving under pressure.
Conclusion
Load testing turns unknowns into knowns and panic into process. It isn't a "nice-to-have", it's essential for delivering fast, reliable digital experiences that customers (and your bottom line) demand.
By following this guide, you'll identify issues early, optimize performance, and build systems that scale confidently.
Ship faster, break less, and stay resilient.
.png)
Resilience Testing Is Non-Negotiable in the Enterprise SDLC
Modern software delivery has dramatically accelerated. AI-assisted development, automated CI/CD pipelines, and cloud-native architectures have made it possible for teams to deploy software dozens of times per day.
But speed alone does not guarantee reliability.
At Conf42 Site Reliability Engineering (SRE) 2026, Uma Mukkara, Head of Resilience Testing at Harness and co-creator of LitmusChaos, delivered a clear message: outages are inevitable. In modern distributed systems, assuming your design will always work is not just optimistic—it’s risky.
In fact, as Uma put it, failure in distributed systems is a mathematical certainty.
That’s why resilience testing must become a core, continuous practice in the Software Development Life Cycle (SDLC).
The Reality of Inevitable Outages
Even the most reliable cloud providers experience outages.
Uma illustrated this with examples that highlight how unpredictable failures can be:
- Physical disruption such as drone strikes affecting AWS Middle East data centers
- Policy or configuration errors that triggered cascading outages on cloud platforms like Azure
- Retry storms and load spikes where services collapse under unexpected demand
These incidents demonstrate an important reality: the types of failures constantly evolve.
A system validated during design may not be resilient against tomorrow’s failure scenarios. Architecture may stay the same, but the failure patterns surrounding it continuously change.
This is why resilience cannot rely on assumptions.
Hope is not a strategy—verification is.
For a deeper look at this broader approach to resilience, see how chaos engineering, load testing, and disaster recovery testing work together.
What Resilience Really Means
Resilience is often misunderstood as simply keeping systems online.
But uptime alone does not make a system resilient.
Uma defines resilience more precisely:
Resilience is the grace with which systems handle failure and return to an active state.
In practice, a resilient system must handle three categories of disruption:
1. System Failures
Pod crashes, node failures, infrastructure disruptions, or network faults.
2. Load Conditions
Traffic spikes or sudden demand that pushes systems to their limits.
3. Disasters
Regional outages, multi-AZ failures, or infrastructure loss that require recovery mechanisms.
If teams test only one of these dimensions, they leave significant risks undiscovered.
True resilience requires verifying how systems behave across all three scenarios.
Continuous Verification in the SDLC
One of the biggest challenges Uma highlighted is how organizations treat resilience.
Many teams still see it as a “day-two problem”—something SREs will handle after systems are deployed.
Others assume that once resilience has been validated during system design, the problem is solved.
In reality, resilience must be continuously verified.
As systems evolve with each release, so do their failure modes. The most effective strategy is to:
- Test resilience continuously
- Verify resilience with every delivery
- Document results across releases
This approach shifts resilience testing into the outer loop of the SDLC, alongside functional and performance testing.
Instead of waiting for production incidents, teams proactively identify weaknesses before customers experience them.
Understanding Resilience Debt
Uma introduced an important concept: resilience debt.
Resilience debt is similar to technical debt. When teams postpone resilience validation, they leave hidden risks unresolved in the system.
Over time, that debt accumulates.
And when failure eventually occurs—which it inevitably will—the business impact grows proportionally to the resilience debt that was ignored.
The only way to reduce this risk is to steadily increase resilience testing coverage over time.
As testing matures across multiple quarters, organizations gain better feedback about system behavior, uncover more risks earlier, and continuously reduce the likelihood of severe outages.
A Holistic Approach to Resilience Testing
Another key takeaway from Uma’s session is that resilience testing should not happen in silos.
Many organizations treat chaos testing, load testing, and disaster recovery validation as separate initiatives owned by different teams.
But the most meaningful risks often appear when these scenarios intersect.
For example:
- A resource bottleneck might only appear when high traffic coincides with a service failure.
- Chaos experiments developed for reliability testing can also be reused in disaster recovery workflows.
- Combining chaos and load tests helps teams observe system behavior at failure limits under real-world conditions.
That’s why resilience testing must be approached as a holistic practice combining:
- Chaos Engineering
- Load Testing
- Disaster Recovery (DR) Validation
You can explore the fundamentals of resilience testing in the Harness documentation.
Collaboration Across Teams
Resilience testing also requires collaboration across multiple roles.
Developers, QA engineers, SREs, and platform teams all contribute to validating system reliability.
Uma pointed out that many organizations already share infrastructure for testing but run different experiments independently. By coordinating these efforts, teams can:
- reuse testing environments
- share chaos experiments across testing scenarios
- validate DR workflows more frequently
- improve testing efficiency across teams
Resilience becomes significantly stronger when personas, environments, and test assets are shared rather than siloed.
The Role of AI in Resilience Testing
As systems become more complex, another challenge emerges: knowing what to test and when.
Large organizations may have hundreds of potential experiments, making it difficult to prioritize testing effectively.
Uma described how agentic AI systems can help address this challenge.
By analyzing internal knowledge sources such as:
- incident data
- CI/CD pipeline history
- infrastructure configuration
- operational documentation
AI systems can recommend:
- the most relevant chaos experiments
- appropriate load testing scenarios
- disaster recovery tests that should run at a given time
These recommendations allow teams to run the right tests at the right moment, improving resilience coverage without overwhelming engineering teams.
A Unified Platform for Resilience Testing
To support this holistic approach, Harness has expanded its original Chaos Engineering capabilities into a broader platform: Harness Resilience Testing.
The platform integrates multiple testing disciplines in a single environment, enabling teams to:
- design chaos experiments
- run load tests
- validate disaster recovery workflows
- observe system risk patterns in one place
By combining these capabilities, teams gain a single pane of glass for identifying resilience risks across the SDLC.
This unified view allows organizations to track trends in system reliability and proactively address weaknesses before they turn into production incidents.
Resilience Is a Core Practice for Modern SRE Teams
Uma closed the session with a clear conclusion.Resilience testing is not optional.
Outages will happen. Infrastructure will fail. Traffic patterns will change. Dependencies will break.
What matters is whether organizations have continuously validated how their systems behave when those failures occur.
The more resilience testing coverage teams build over time, the more feedback they receive—and the lower the potential business impact becomes.
In modern software delivery, resilience is no longer just a reliability practice.
It is a core discipline of the enterprise SDLC.
Ready to start validating your system’s resilience?
Explore Harness Resilience Testing and start validating reliability across your SDLC.

From Chaos Engineering to Resilience Testing: Why We’re Expanding How Teams Validate Reliability
At Harness, we’re committed to helping teams build and deliver software that doesn’t just work – it thrives under pressure, scales reliably, and recovers swiftly from the unexpected. Today, we’re taking the next step in that mission by evolving our Chaos Engineering module into Resilience Testing.
This evolution reflects how reliability is tested in practice today. While Chaos Engineering has long been a powerful way to proactively identify weaknesses through controlled fault injection, many teams – SREs, platform engineers, performance specialists, and DevOps leaders – are already validating resilience across the same workflows:
- How systems behave when dependencies fail
- How services perform under sustained load
- How infrastructure and applications recover during real outages
Resilience Testing brings these efforts together into a single, continuous approach.
Built On Open Source and Real Systems
My work in Chaos Engineering started with a simple goal: make resilience testing practical for real-world systems. Before that, I spent years building foundational cloud-native infrastructure at places like CloudByte and MayaData, and I kept coming back to the same lesson: you learn fastest when you build in the open and stay close to production users.
Before joining Harness, my team and I created LitmusChaos to help teams running Kubernetes understand how their systems actually behave under failure. What began as an open source project grew into one of the most widely adopted chaos engineering projects in the CNCF, used by organizations testing real production environments.
When Harness acquired Chaos Native in 2022, it was clear we shared the same belief: chaos engineering shouldn’t be a standalone activity. It belongs inside the software delivery lifecycle. We then donated LitmusChaos to the CNCF, and Harness continues to actively maintain and contribute to the project today.
That combination of open source leadership and enterprise integration has directly shaped how chaos engineering evolved inside Harness.
How Chaos Engineering Expanded in Practice
Over the past four years, teams using Chaos Engineering pushed beyond isolated experiments toward broader resilience workflows.
What mattered most wasn’t injecting failures – it was understanding what to test, when to test, and how to learn continuously. That led to deeper capabilities around service and dependency discovery, targeted risk testing, monitoring-driven validation, automated gamedays, and AI-assisted recommendations.
As software delivery has become more automated and increasingly AI-assisted, these same principles naturally extended beyond chaos engineering alone.
Introducing Resilience Testing
Today, we’re launching Resilience Testing, with new Load Testing and Disaster Recovery Testing capabilities built on top of our Chaos Engineering foundation.
Resilience Testing brings together three core areas:
- Chaos Engineering to validate failure handling and recovery
- Load Testing to understand behavior under scale and stress
- Disaster Recovery Testing to prove readiness for real outages
These capabilities are unified through automation and AI-driven insights, helping teams prioritize risk, improve coverage, and continuously validate resilience as systems evolve.
Chaos Eengineering gave us a strong foundation, and Resilience Testing is the broader practice teams have been building toward as systems and workflows evolve.
A Milestone Shaped By Community
This evolution follows years of collaboration with the broader resilience engineering community, including Chaos Carnival, now in its sixth year, which brings together thousands of engineers sharing real lessons from production systems.
As systems grow more dynamic and AI-driven, resilience testing must move beyond periodic checks toward continuous, intelligent validation. Resilience Testing is designed for that reality, and it reflects what we’ve learned building, operating, and scaling real systems over time.
Ready to expand beyond chaos experiments? Talk to your Harness representative to enable the new capabilities, or book a demo with our team to explore the right rollout for your environment.

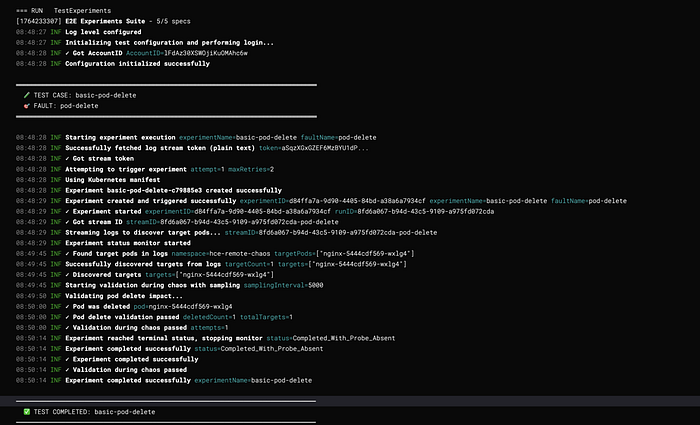
Theory to Turbulence: Building a Developer-Friendly E2E Testing Framework for Chaos Platform
As an enterprise chaos engineering platform vendor, validating chaos faults is not optional — it’s foundational. Every fault we ship must behave predictably, fail safely, and produce measurable impact across real-world environments.
When we began building our end-to-end (E2E) testing framework, we quickly ran into a familiar problem: the barrier to entry was painfully high.
Running even a single test required a long and fragile setup process:
- Installing multiple dependencies by hand
- Configuring a maze of environment variables
- Writing YAML-based chaos experiments manually
- Debugging cryptic validation failures
- Only then… executing the first test
This approach slowed feedback loops, discouraged adoption, and made iterative testing expensive — exactly the opposite of what chaos engineering should enable.
The Solution: A Simplified Chaos Fault Validation Framework
To solve this, we built a comprehensive yet developer-friendly E2E testing framework for chaos fault validation. The goal was simple: reduce setup friction without sacrificing control or correctness.
The result is a framework that offers:
- An API-driven execution model instead of manual YAML wiring
- Real-time log streaming for faster debugging and observability
- Intelligent target discovery to eliminate repetitive configuration
- Dual-phase validation to verify both fault injection and system impact
What previously took 30 minutes (or more) to set up and run can now be executed in under 5 minutes — consistently and at scale.
System Architecture
High-Level Architecture

Layer Responsibilities
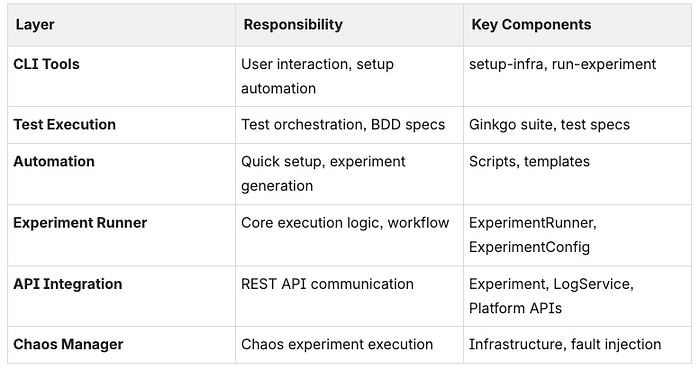
Core Components
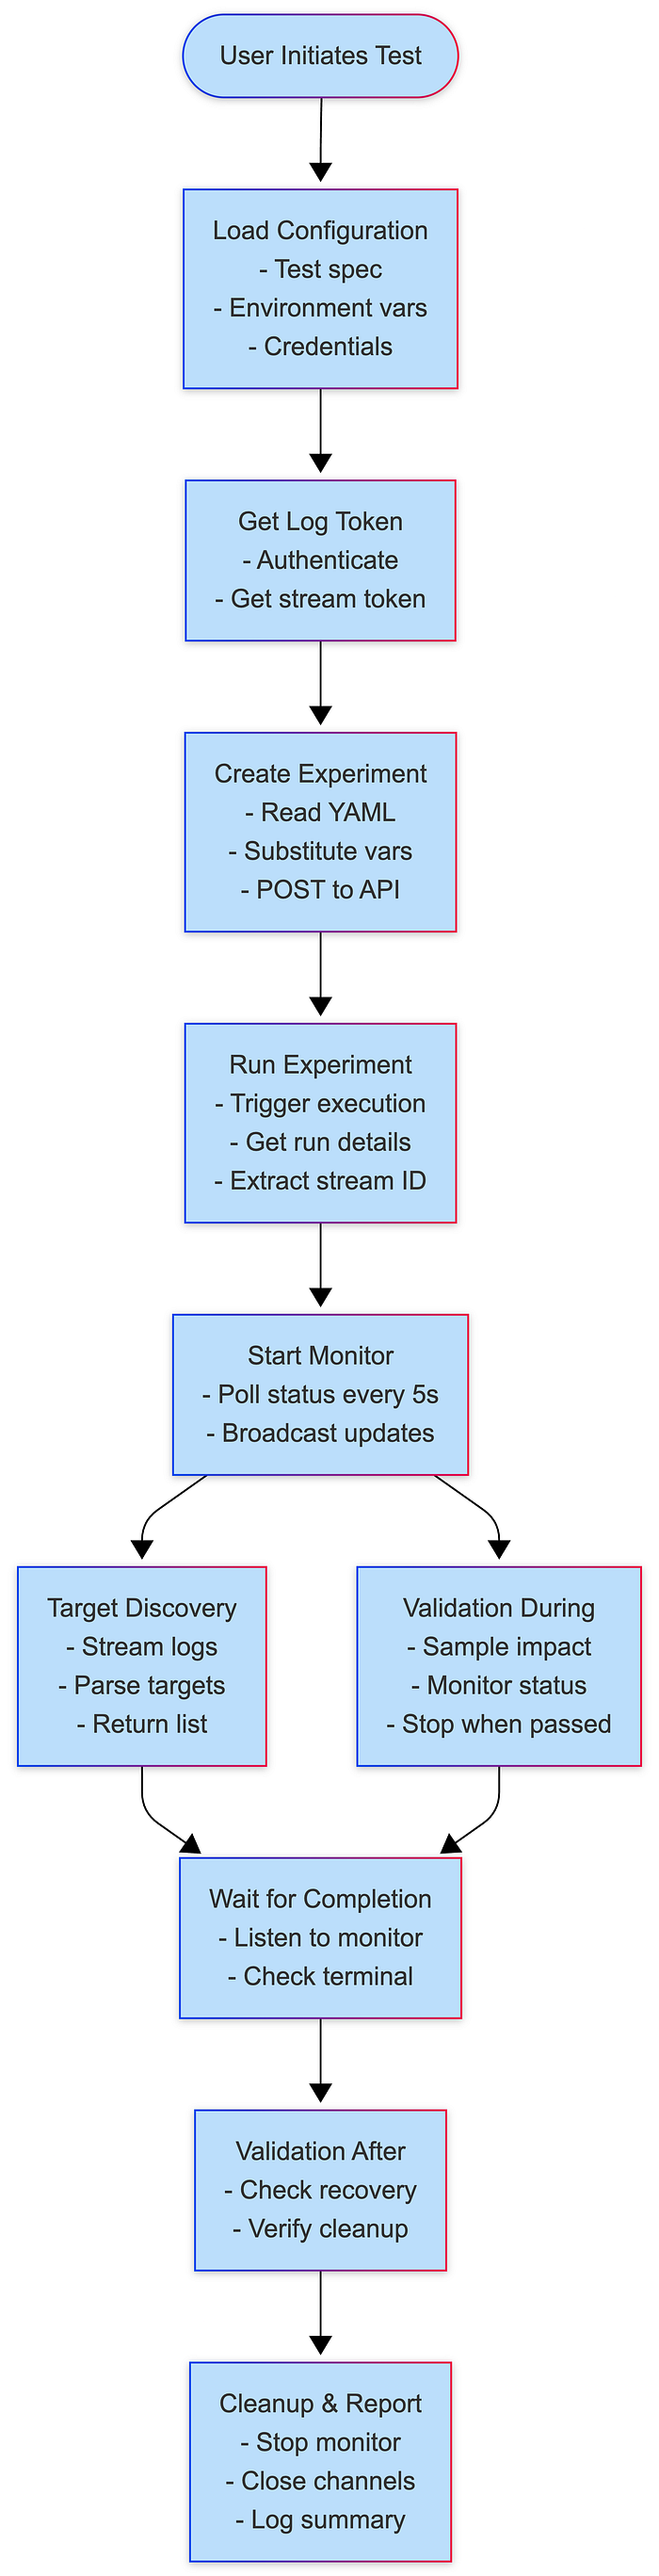
1. Experiment Runner
Purpose: Orchestrates the complete chaos experiment lifecycle from creation to validation.
Key Responsibilities:
- Experiment creation with variable substitution
- Log streaming and target discovery
- Concurrent validation management
- Status monitoring and completion detection
- Error handling and retry logic
Architecture Pattern: Template Method + Observer
type ExperimentRunner struct {
    identifiers utils.Identifiers
    config      ExperimentConfig
}
type ExperimentConfig struct {
    Name                  string
    FaultName             string
    ExperimentYAML        string
    InfraID               string
    InfraType             string
    TargetNamespace       string
    TargetLabel           string
    TargetKind            string
    FaultEnv              map[string]string
    Timeout               time.Duration
    SkipTargetDiscovery   bool
    ValidationDuringChaos ValidationFunc
    ValidationAfterChaos  ValidationFunc
    SamplingInterval      time.Duration
    }
Execution Flow:
Run() →
  1. getLogToken()
  2. triggerExperimentWithRetry()
  3. Start experimentMonitor
  4. extractStreamID()
  5. getTargetsFromLogs()
  6. runValidationDuringChaos() [parallel]
  7. waitForCompletion()
  8. Validate ValidationAfterChaos
2. Experiment Monitor
Purpose: Centralized experiment status tracking with publish-subscribe pattern.
Architecture Pattern: Observer Pattern
type experimentMonitor struct {
    experimentID string
    runResp      *experiments.ExperimentRunResponse
    identifiers  utils.Identifiers
    stopChan     chan bool
    statusChan   chan string
    subscribers  []chan string
}
Key Methods:
start(): Begin monitoring (go-routine)subscribe(): Create subscriber channelbroadcast(status): Notify all subscribersstop(): Signal monitoring to stop
Benefits:
- 80% reduction in API calls
- 92% faster failure detection
- Single source of truth
- Easy to add new consumers
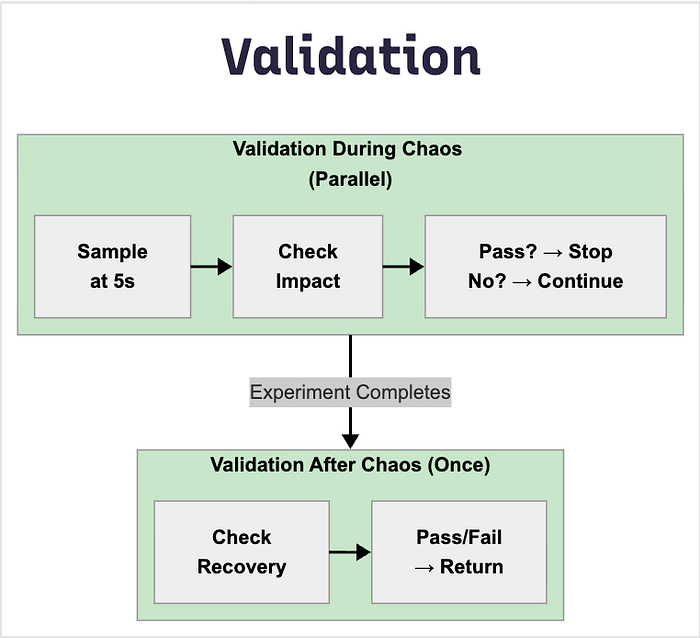
3. Validation Framework
Purpose: Dual-phase validation system for concrete chaos impact verification.
ValidationDuringChaos
- Runs in parallel during experiment
- Continuous sampling at configurable intervals
- Stops when validation passes
- Use case: Verify active fault impact
ValidationAfterChaos
- Runs once after experiment completes
- Single execution for final state
- Use case: Verify recovery and cleanup
Function Signature:
type ValidationFunc func(targets []string, namespace string) (bool, error)
// Returns: (passed bool, error)
Sample Validation Categories:

Experiment Execution Engine
Execution Phases
Phase 1: Setup
├─ Load configuration
├─ Authenticate with API
└─ Validate environment
Phase 2: Preparation
├─ Get log stream token
├─ Resolve experiment YAML path
├─ Substitute template variables
└─ Create experiment via API
Phase 3: Execution
├─ Trigger experiment run
├─ Start status monitor
├─ Extract stream ID
└─ Discover targets from logs
Phase 4: Validation (Concurrent)
├─ Validation During Chaos (parallel)
│ ├─ Sample at intervals
│ ├─ Check fault impact
│ └─ Stop when passed/completed
└─ Wait for completion
Phase 5: Post-Validation
├─ Validation After Chaos
├─ Check recovery
└─ Final assertions
Phase 6: Cleanup
├─ Stop monitor
├─ Close channels
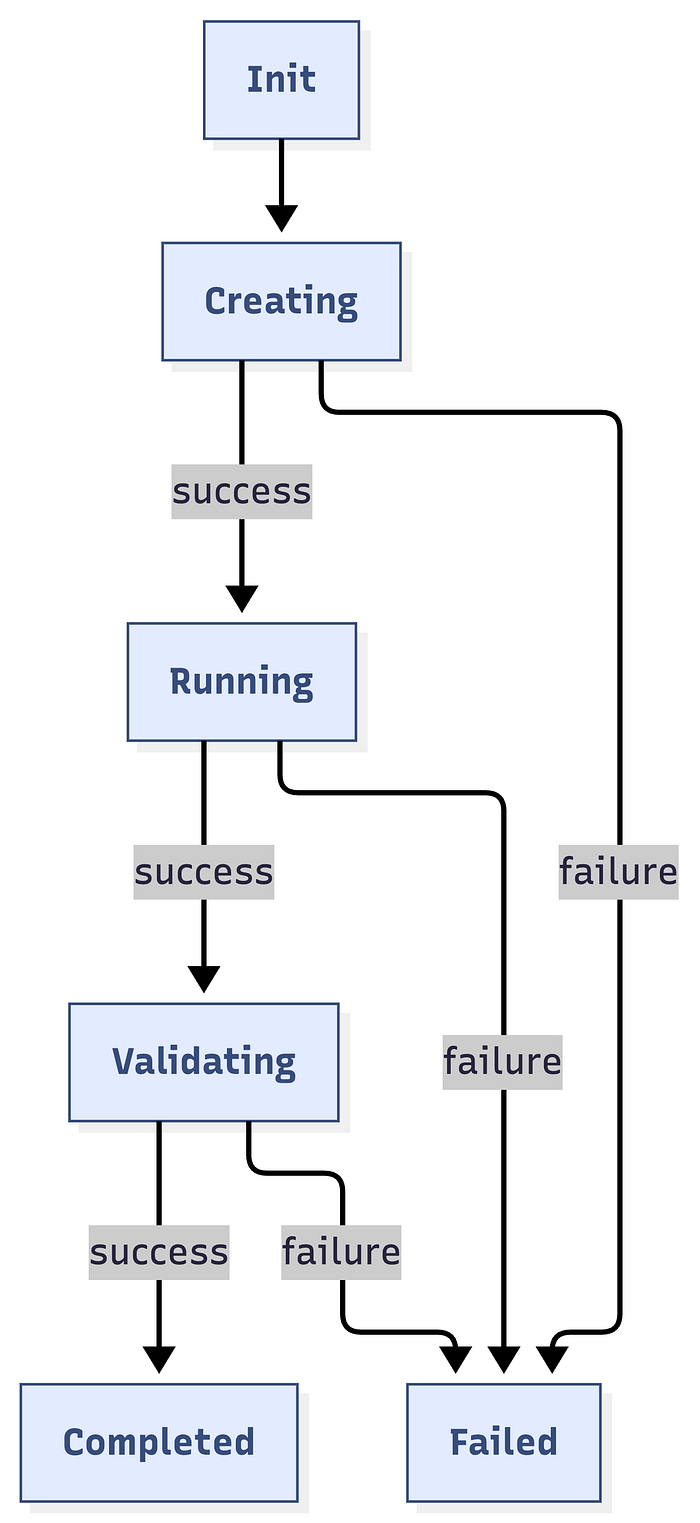
└─ Log resultsState Machine
Concurrency Model
Main Thread:
├─ Create experiment
├─ Start monitor goroutine
├─ Start target discovery goroutine
├─ Start validation goroutine [if provided]
└─ Wait for completion
Monitor Goroutine:
├─ Poll status every 5s
├─ Broadcast to subscribers
└─ Stop on terminal status
Target Discovery Goroutine:
├─ Subscribe to monitor
├─ Poll for targets every 5s
├─ Listen for failures
└─ Return when found or failed
Validation Goroutine:
├─ Subscribe to monitor
├─ Run validation at intervals
├─ Listen for completion
└─ Stop when passed or completed
API Integration Layer
API Client Architecture

Variable Substitution System
Template Format: {{ VARIABLE_NAME }}
Built-in Variables:
INFRA_NAMESPACE          // Infrastructure namespace
FAULT_INFRA_ID          // Infrastructure ID (without env prefix)
EXPERIMENT_INFRA_ID     // Full infrastructure ID (env/infra)
TARGET_WORKLOAD_KIND    // deployment, statefulset, daemonset
TARGET_WORKLOAD_NAMESPACE // Target namespace
TARGET_WORKLOAD_NAMES   // Specific workload names (or empty)
TARGET_WORKLOAD_LABELS  // Label selector
EXPERIMENT_NAME         // Experiment name
FAULT_NAME              // Fault type
TOTAL_CHAOS_DURATION    // Duration in seconds
CHAOS_INTERVAL          // Interval between chaos actions
ADDITIONAL_ENV_VARS     // Fault-specific environment variables
Custom Variables: Passed via FaultEnv map in ExperimentConfig.
Validation Framework
Architecture
Validation Categories
1. Resource Validators
ValidatePodCPUStress(targets, namespace) (bool, error)
ValidatePodMemoryStress(targets, namespace) (bool, error)
ValidateDiskFill(targets, namespace) (bool, error)
ValidateIOStress(targets, namespace) (bool, error)
Detection Logic:
- CPU: Usage > baseline + 30%
- Memory: Usage > baseline + 20%
- Disk: Usage > 80%
- I/O: Read/write operations elevated
2. Network Validators
ValidateNetworkLatency(targets, namespace) (bool, error)
ValidateNetworkLoss(targets, namespace) (bool, error)
ValidateNetworkCorruption(targets, namespace) (bool, error)
Detection Methods:
- Ping latency measurements
- Packet loss percentage
- Checksum errors
3. Pod Lifecycle Validators
ValidatePodDelete(targets, namespace) (bool, error)
ValidatePodRestarted(targets, namespace) (bool, error)
ValidatePodsRunning(targets, namespace) (bool, error)
Verification:
- Pod age comparison
- Restart count increase
- Ready status check
4. Application Validators
ValidateAPIBlock(targets, namespace) (bool, error)
ValidateAPILatency(targets, namespace) (bool, error)
ValidateAPIStatusCode(targets, namespace) (bool, error)
ValidateFunctionError(targets, namespace) (bool, error)
5. Redis Validators
ValidateRedisCacheLimit(targets, namespace) (bool, error)
ValidateRedisCachePenetration(targets, namespace) (bool, error)
ValidateRedisCacheExpire(targets, namespace) (bool, error)
Direct Validation: Executes redis-cli INFO in pod, parses metrics
Validation Best Practices

Data Flow & Lifecycle
Complete Experiment Lifecycle
Data Structures Flow
// Input
ExperimentConfig
    ↓
// API Creation
ExperimentPayload (JSON)
    ↓
// API Response
ExperimentResponse {ExperimentID, Name}
    ↓
// Run Request
ExperimentRunRequest {NotifyID}
    ↓
// Run Response
ExperimentRunResponse {ExperimentRunID, Status, Nodes}
    ↓
// Log Streaming
StreamToken + StreamID
    ↓
// Target Discovery
[]string (target pod names)
    ↓
// Validation
ValidationFunc(targets, namespace) → (bool, error)
    ↓
// Final Result
Test Pass/Fail with error details
Performance & Scalability
Performance Metrics

Concurrent Test Execution
- Each test gets isolated namespace
- Separate experiment instances
- No shared state between tests
- Parallel execution supported
Example Usage of Framework
RunExperiment(ExperimentConfig{
    Name: "CPU Stress Test",
    FaultName: "pod-cpu-hog",
    InfraID:         infraID,
    ProjectID:       projectId,
    TargetNamespace: targetNamespace,
    TargetLabel:     "app=nginx", // Customize based on your test app
    TargetKind:      "deployment",
    FaultEnv: map[string]string{
     "CPU_CORES":            "1",
     "TOTAL_CHAOS_DURATION": "60",
     "PODS_AFFECTED_PERC":   "100",
     "RAMP_TIME":            "0",
    },
    Timeout:          timeout,
    SamplingInterval: 5 * time.Second, // Check every 5 seconds during chaos

    // Verify CPU is stressed during chaos
    ValidationDuringChaos: func(targets []string, namespace string) (bool, error) {
         clientset, err := faultcommon.GetKubeClient()
         if err != nil {
          return false, err
         }
         return validations.ValidatePodCPUStress(clientset, targets, namespace)
    },

    // Verify pods recovered after chaos
    ValidationAfterChaos: func(targets []string, namespace string) (bool,error) {
        clientset, err := faultcommon.GetKubeClient()
        if err != nil {
         return false, err
        }
        return validations.ValidateTargetAppsHealthy(clientset, targets, namespace)
    },
})
Knowledge Sharing and Learning
While this framework is proprietary and used internally, we believe in sharing knowledge and best practices. The patterns and approaches we’ve developed can help other teams building similar testing infrastructure:
Key Takeaways for Your Team
Whether you’re building a chaos engineering platform, testing distributed systems, or creating any complex testing infrastructure, these principles apply:
- Measure your baseline — Know how long things take today
- Set ambitious goals — 10x improvements are possible
- Prioritize DX — Developer experience drives adoption
- Automate ruthlessly — Eliminate manual steps
- Share your learnings — Help others avoid the same pitfalls
- Collect user feedback
- Celebrate improvements!
We hope these insights help you build better testing infrastructure for your team!
Questions? Feedback? Ideas? Join Harness community. We’d love to hear about your testing challenges and how you’re solving them!

Recommended Experiments for Production Resilience in Harness Resilience Testing
Building reliable distributed systems isn't just about writing good code. It's about understanding how your systems behave when things go wrong. That's where chaos engineering comes in.
If you've been wondering where to start with chaos experiments or what scenarios matter most for your infrastructure, this guide walks through battle-tested experiments that engineering teams use to validate production resilience.
Why These Experiments Matter
Here's the thing about production failures: they're not just theoretical. Network issues happen. Availability zones go down. Resources get exhausted. The question isn't whether these failures will occur, but whether your system can handle them gracefully when they do.
The experiments we'll cover are based on real-world failure scenarios that teams encounter in production. We've organized them by infrastructure type so you can quickly find what's relevant to your stack.
A quick tip before we dive in: Start with lower blast radius experiments (like pod-level faults) before progressing to higher impact scenarios (like node or zone failures). This gives you confidence in your testing approach and helps you understand your system's behavior patterns.
Understanding Your Infrastructure Needs
Different infrastructure types face different challenges. Here's what we'll cover:
- Kubernetes Experiments
- AWS Experiments
- Azure Experiments
- GCP Experiments
Let's explore each of these in detail.
Kubernetes: The Foundation of Modern Applications
For Kubernetes environments, chaos experiments typically focus on four key areas. Let's walk through each one.
Network Resilience Testing
Network-related failures are among the most common issues in distributed systems. Your application might be perfectly coded, but if it can't handle network degradation, you're setting yourself up for production incidents.
Here are the experiments that matter:
Pod Network Loss tests application resilience to network packet loss at the pod level. This is your first line of defense for understanding how individual components handle network issues.
Node Network Loss simulates network issues affecting entire nodes. This is a node-level experiment that helps you understand how your system behaves when an entire node becomes unreachable.
Pod Network Latency tests application behavior under high latency conditions at the pod level. Latency often reveals performance bottlenecks and timeout configuration issues.
Pod API Block allows you to block specific API endpoints or services at the pod level. This is particularly useful for testing service dependencies and circuit breaker implementations.
Resource Exhaustion Testing
Resource exhaustion is another common failure mode. How does your application behave when CPU or memory becomes constrained? These experiments help you understand whether your resource limits are set correctly and how your application handles resource constraints before they become production problems.
Pod CPU Hog tests application behavior under CPU pressure at the pod level. This helps validate whether your CPU limits are appropriate and how your application degrades under CPU constraints.
Pod Memory Hog validates memory limit handling and out-of-memory (OOM) scenarios at the pod level. Understanding memory behavior prevents unexpected pod restarts in production.
Node CPU Hog tests node-level CPU exhaustion. This experiment reveals how your cluster handles resource pressure when an entire node's CPU is saturated.
Node Memory Hog simulates node memory pressure at the node level. This is critical for understanding how Kubernetes evicts pods and manages memory across your cluster.
Availability Zone Failures
Multi-AZ deployments are great for resilience, but only if they're actually resilient. Zone failure experiments validate that your multi-AZ setup works as expected.
Node Network Loss can simulate complete zone failure when configured with node labels to target specific zones. This is your primary tool for validating zone-level resilience.
Pod Network Loss enables zone-level pod network isolation by targeting pods in specific zones. This gives you more granular control over which applications you test during zone failures.
For detailed zone failure configurations, see the Simulating Zonal Failures section below.
Pod Lifecycle Testing
Pods come and go. That's the nature of Kubernetes. But does your application handle these transitions gracefully? These experiments ensure your application handles the dynamic nature of Kubernetes without dropping requests or losing data.
Pod Delete tests graceful shutdown and restart behavior at the pod level. This is fundamental for validating that your application can handle rolling updates and scaling events.
Container Kill validates container restart policies at the container level. This ensures that individual container failures don't cascade into broader application issues.
Pod Autoscaler tests Horizontal Pod Autoscaler (HPA) behavior under load at the pod level. This validates that your autoscaling configuration responds appropriately to demand changes.
Simulating Zonal Failures
Zonal failures simulate complete availability zone outages, which are critical for validating multi-AZ deployments. Let's look at how to configure these experiments properly.
Node Network Loss for Zonal Failures
The Node Network Loss experiment simulates a complete zone failure by blocking all network traffic to nodes in a specific availability zone.
Key Parameters:
TOTAL_CHAOS_DURATION should be set to 300 seconds (5 minutes) for realistic zone failure testing. This duration gives you enough time to observe failover behavior and recovery processes.
NETWORK_PACKET_LOSS_PERCENTAGE should be set to 100% to achieve complete network isolation, simulating a total zone failure rather than degraded connectivity.
NETWORK_INTERFACE typically uses eth0 as the primary network interface. Verify your cluster's network configuration if you're using a different interface name.
NODES_AFFECTED_PERC should be set to 100 to affect all nodes matching the target label, ensuring complete zone isolation.
NODE_LABEL is critical for targeting specific availability zones. Use topology.kubernetes.io/zone=<zone-name> to select nodes in a particular zone.
Common Zone Labels:
For AWS deployments, use topology.kubernetes.io/zone=us-east-1a (or your specific zone).
For GCP deployments, use topology.kubernetes.io/zone=us-central1-a (or your specific zone).
For Azure deployments, use topology.kubernetes.io/zone=eastus-1 (or your specific zone).
Pod Network Loss for Zonal Failures
The Pod Network Loss experiment provides more granular control by targeting specific applications within a zone. This is useful when you want to test how individual services handle zone failures without affecting your entire infrastructure.
Key Parameters:
TARGET_NAMESPACE specifies the namespace containing your target application. This allows you to isolate experiments to specific environments or teams.
APP_LABEL uses an application label selector (e.g., app=frontend) to target specific applications. This gives you precise control over which services are affected.
TOTAL_CHAOS_DURATION should be set to 300 seconds for realistic zone failure scenarios, matching the duration used in node-level experiments.
NETWORK_PACKET_LOSS_PERCENTAGE should be 100% to simulate complete network isolation for the targeted pods.
PODS_AFFECTED_PERC determines the percentage of pods matching your criteria to affect. Set to 100 for complete zone failure simulation, or lower values for partial failures.
NETWORK_INTERFACE typically uses eth0 as the primary network interface for pod networking.
NODE_LABEL should use topology.kubernetes.io/zone=<zone-name> to target pods running in a specific availability zone.
Network Experiment Best Practices
When running network experiments, there are some important considerations to keep in mind.
General Guidelines
Start Small: Begin with shorter durations (30-60 seconds) and gradually increase as you build confidence in your experiments and understand your system's behavior.
Use Probes: Always configure health probes to validate application behavior during experiments. This gives you objective data about whether your hypothesis was correct.
Monitor Metrics: Track application and infrastructure metrics during experiments. CPU usage, memory consumption, request latency, and error rates are all critical indicators.
Schedule Wisely: Run experiments during maintenance windows or low-traffic periods initially. As you build confidence, you can move to running experiments during normal operations.
Document Results: Keep records of experiment outcomes and system behavior. This creates institutional knowledge and helps track improvements over time.
Pod Network Loss Considerations
One important thing to understand: Pod Network Loss experiments always block egress traffic from the target pods. This is crucial for experiment design. You can configure specific destination hosts or IPs to block, or you can simulate complete network isolation.
Important Parameters:
TARGET_NAMESPACE specifies your target namespace (e.g., production). This ensures experiments run in the correct environment.
APP_LABEL uses an application label selector like app=api-service to target specific applications precisely.
TOTAL_CHAOS_DURATION sets the experiment duration, typically 180 seconds (3 minutes) for most scenarios.
DESTINATION_HOSTS allows you to specify particular services to block using comma-separated hostnames (e.g., database.example.com). Leave empty to block all egress traffic.
DESTINATION_IPS lets you block specific IP addresses using comma-separated values (e.g., 10.0.1.50). This is useful when you know the exact IPs of backend services.
PODS_AFFECTED_PERC determines what percentage of matching pods to affect. Set to 100 to test complete service isolation.
NETWORK_INTERFACE specifies the network interface to target, typically eth0 for standard Kubernetes deployments.
Pod API Block for Egress Traffic
When using Pod API Block, you have fine-grained control. You can block specific API paths, target particular services, and choose whether to block egress or ingress traffic.
Important Parameters for Egress:
TARGET_CONTAINER specifies the container name within the pod that will experience the API block.
TARGET_SERVICE_PORT sets the target service port (e.g., 8080) for the API endpoint you're testing.
TOTAL_CHAOS_DURATION determines experiment duration, typically 180 seconds for API-level testing.
PATH_FILTER allows you to block a specific API path like /api/v1/users, enabling surgical testing of individual endpoints.
DESTINATION_HOSTS specifies target service hostnames using comma-separated values (e.g., api.example.com).
SERVICE_DIRECTION should be set to egress for blocking outbound API calls from the target container.
PODS_AFFECTED_PERC determines the percentage of pods to affect, typically 100 for comprehensive testing.
Pod API Block for Ingress Traffic
For ingress testing, you could block incoming health check requests to see how your monitoring responds.
Important Parameters for Ingress:
TARGET_CONTAINER specifies the container name within the pod that will block incoming requests.
TARGET_SERVICE_PORT sets the port receiving traffic, typically 8080 or your application's serving port.
TOTAL_CHAOS_DURATION determines the experiment duration, usually 180 seconds for health check testing.
PATH_FILTER allows you to block a specific incoming path like /health to test monitoring resilience.
SOURCE_HOSTS specifies source hostnames using comma-separated values (e.g., monitoring.example.com).
SOURCE_IPS lets you target specific source IP addresses using comma-separated values (e.g., 10.0.2.100).
SERVICE_DIRECTION should be set to ingress for blocking incoming requests to the target container.
PODS_AFFECTED_PERC determines the percentage of pods to affect, typically 100 for complete testing.
AWS: Cloud Infrastructure Resilience
AWS infrastructure brings its own set of failure modes. Here's what matters most for AWS workloads.
Recommended AWS Experiments
EC2 Stop simulates EC2 instance failure with high impact. This tests your application's ability to handle sudden instance termination and validates auto-scaling group behavior.
EBS Loss tests application behavior on volume detachment with high impact. This is critical for applications with persistent storage requirements.
ALB AZ Down simulates load balancer AZ failure with medium impact. This validates that your multi-AZ load balancer configuration works as expected.
RDS Reboot tests database failover with high impact. This ensures your database layer can handle planned and unplanned reboots.
Important: AWS experiments require proper IAM permissions. See AWS Fault Permissions for details.
EC2 Stop by ID
The EC2 Stop by ID experiment stops EC2 instances to test application resilience to instance failures and validate failover capabilities.
Key Parameters:
EC2_INSTANCE_ID accepts a comma-separated list of target EC2 instance IDs. You can target a single instance or multiple instances simultaneously.
REGION specifies the AWS region name of the target instances (e.g., us-east-1). All instances in a single experiment must be in the same region.
TOTAL_CHAOS_DURATION is typically set to 30 seconds, which is long enough to trigger failover mechanisms while minimizing impact.
CHAOS_INTERVAL determines the interval between successive instance terminations, typically 30 seconds for sequential failures.
SEQUENCE can be either parallel or serial. Use parallel to stop all instances simultaneously, or serial to stop them one at a time.
MANAGED_NODEGROUP should be set to disable for standard EC2 instances, or enable for self-managed node groups in EKS.
EBS Loss by ID
The EBS Loss by ID experiment detaches EBS volumes to test application behavior when storage becomes unavailable.
Key Parameters:
EBS_VOLUME_ID accepts a comma-separated list of EBS volume IDs to detach. Choose volumes that are critical to your application's operation.
REGION specifies the region name for the target volumes (e.g., us-east-1). Ensure volumes and instances are in the same region.
TOTAL_CHAOS_DURATION is typically 30 seconds, giving you enough time to observe storage failure behavior without extended downtime.
CHAOS_INTERVAL sets the interval between attachment and detachment cycles, usually 30 seconds.
SEQUENCE determines whether volumes are detached in parallel or serial order. Parallel tests simultaneous storage failures.
ALB AZ Down
The ALB AZ Down experiment detaches availability zones from Application Load Balancer to test multi-AZ resilience.
Key Parameters:
LOAD_BALANCER_ARN specifies the target load balancer ARN. You can find this in your AWS console or CLI.
ZONES accepts comma-separated zones to detach (e.g., us-east-1a). Choose zones strategically to test failover behavior.
REGION specifies the region name for the target ALB (e.g., us-east-1).
TOTAL_CHAOS_DURATION is typically 30 seconds for ALB experiments, sufficient to test traffic redistribution.
CHAOS_INTERVAL determines the interval between detachment and attachment cycles, usually 30 seconds.
SEQUENCE can be parallel or serial for detaching multiple zones.
Note: A minimum of two AZs must remain attached to the ALB after chaos injection.
RDS Instance Reboot
The RDS Instance Reboot experiment reboots RDS instances to test database failover and application recovery.
Key Parameters:
CLUSTER_NAME specifies the name of the target RDS cluster. This is required for cluster-level operations.
RDS_INSTANCE_IDENTIFIER sets the name of the target RDS instance within the cluster.
REGION specifies the region name for the target RDS (e.g., us-east-1).
TOTAL_CHAOS_DURATION is typically 30 seconds for the chaos duration, though the actual reboot may take longer.
INSTANCE_AFFECTED_PERC determines the percentage of RDS instances to target. Set to 0 to target exactly 1 instance.
SEQUENCE can be parallel or serial for rebooting multiple instances.
Azure: Testing Your Azure Workloads
For Azure deployments, focus on these key experiments to validate resilience to Azure-specific failures and service disruptions.
Recommended Azure Experiments
Azure Instance Stop simulates VM failure with high impact. This validates that your Azure-based applications can handle unexpected VM termination.
Azure Disk Loss tests disk detachment scenarios with high impact. This is essential for applications with persistent storage on Azure.
Azure Web App Stop validates App Service resilience with medium impact. This tests your PaaS-based applications' ability to handle service disruptions.
Azure Instance Stop
The Azure Instance Stop experiment powers off Azure VM instances to test application resilience to unexpected VM failures.
Key Parameters:
AZURE_INSTANCE_NAMES specifies the name of target Azure instances. For AKS clusters, use the Scale Set name, not the node name from the AKS node pool.
RESOURCE_GROUP sets the name of the resource group containing the target instance. This is required for Azure resource identification.
SCALE_SET should be set to disable for standalone VMs, or enable if the instance is part of a Virtual Machine Scale Set.
TOTAL_CHAOS_DURATION is typically 30 seconds, providing enough time to observe failover without extended disruption.
CHAOS_INTERVAL determines the interval between successive instance power-offs, usually 30 seconds.
SEQUENCE can be parallel or serial for stopping multiple instances.
Tip: For AKS nodes, use the Scale Set instance name from Azure, not the node name from AKS node pool.
GCP: Google Cloud Platform Resilience
For GCP workloads, these experiments validate compute and storage resilience.
Recommended GCP Experiments
GCP VM Instance Stop simulates compute instance failure with high impact. This tests your GCP-based applications' resilience to unexpected instance termination.
GCP VM Disk Loss tests persistent disk detachment with high impact. This validates how your applications handle storage failures on GCP.
GCP VM Instance Stop
The GCP VM Instance Stop experiment powers off GCP VM instances to test application resilience to unexpected instance failures.
Key Parameters:
GCP_PROJECT_ID specifies the ID of the GCP project containing the VM instances. This is required for resource identification.
VM_INSTANCE_NAMES accepts a comma-separated list of target VM instance names within the project.
ZONES specifies the zones of target instances in the same order as instance names. Each instance needs its corresponding zone.
TOTAL_CHAOS_DURATION is typically 30 seconds, sufficient for testing instance failure scenarios.
CHAOS_INTERVAL determines the interval between successive instance terminations, usually 30 seconds.
MANAGED_INSTANCE_GROUP should be set to disable for standalone VMs, or enable if instances are part of a managed instance group.
SEQUENCE can be parallel or serial for stopping multiple instances.
Required IAM Permissions:
Your service account needs compute.instances.get to retrieve instance information, compute.instances.stop to power off instances, and compute.instances.start to restore instances after the experiment.
Experiment Design Best Practices
Now that we've covered the experiments, let's talk about how to run them effectively.
1. Define Clear Hypotheses
Before running any experiment, define what you expect to happen. For example: "When 50% of pods lose network connectivity, the application should continue serving requests with increased latency but no errors."
This clarity helps you know what to measure and when something unexpected happens.
2. Use Resilience Probes
Always configure probes to validate your hypothesis:
HTTP Probes monitor application endpoints to verify they're responding correctly during chaos.
Command Probes check system state by running commands and validating output.
Prometheus Probes validate metrics thresholds to ensure performance stays within acceptable bounds.
Learn more about Resilience Probes.
3. Gradual Blast Radius Increase
Follow this progression:
Single Pod/Container experiments test individual component resilience. Start here to understand how your smallest units behave.
Multiple Pods validate load balancing and failover at the service level. This ensures traffic distributes correctly.
Node Level tests infrastructure resilience by affecting entire nodes. This reveals cluster-level behaviors.
Zone Level validates multi-AZ deployments by simulating complete zone failures. This is your ultimate resilience test.
4. Schedule Regular Experiments
Make chaos engineering a continuous practice:
Weekly: Run low-impact experiments like pod delete and network latency. These keep your team sharp and validate recent changes.
Monthly: Execute medium-impact experiments including node failures and resource exhaustion. These catch configuration drift.
Quarterly: Conduct high-impact scenarios like zone failures and major service disruptions. These validate your disaster recovery plans.
Use GameDays to organize team chaos engineering events.
5. Monitor and Alert
Ensure proper observability during experiments:
Configure alerts for critical metrics before running experiments. You want to know immediately if something goes wrong.
Monitor application logs in real-time during experiments. Logs often reveal issues before metrics do.
Track infrastructure metrics including CPU, memory, and network utilization. These help you understand resource consumption patterns.
Use Chaos Dashboard for visualization and real-time monitoring of your experiments.
Getting Started
The best way to get started with chaos engineering is to pick one experiment that addresses your biggest concern. Are you worried about network reliability? Start with Pod Network Loss. Concerned about failover? Try Pod Delete or EC2 Stop.
Run the experiment in a test environment first. Observe what happens. Refine your hypothesis. Then gradually move toward production environments as you build confidence.
Here are some helpful resources to continue your chaos engineering journey:
- Create Your First Experiment
- Configure Resilience Probes
- Set Up GameDays
- Integrate with CI/CD
- Explore All Kubernetes Faults
Remember, chaos engineering isn't about breaking things for the sake of breaking them. It's about understanding your system's behavior under stress so you can build more resilient applications. Start small, learn continuously, and gradually expand your chaos engineering practice.
What failure scenarios keep you up at night? Those are probably the best experiments to start with.

Making Your Business Resilient Against Cloudflare Like Outages
In the fast-paced digital world, a single point of failure can ripple across the globe, halting operations and frustrating millions. On November 18, 2025, that's exactly what happened when Cloudflare—a backbone for internet infrastructure—experienced a major outage. Sites like X (formerly Twitter), ChatGPT, and countless businesses relying on Cloudflare's CDN, DNS, and security services ground to a halt, serving 5xx errors and leaving users staring at blank screens. If your business depends on cloud services, this event is a stark reminder: resilience isn't optional; it's essential.
As sponsors of the Chaos Engineering tool LitmusChaos and as providers of resilience testing solutions from Harness, we've seen firsthand how proactive testing can turn potential disasters into minor blips. In this post, we'll break down what went wrong, the ripple effects on businesses, proven strategies to bounce back stronger, and why tools like ours are game-changers. Let's dive in.
What Happened During The Cloudflare Outage?
The outage kicked off around 11:20 UTC on November 18, with a surge in 5xx errors hitting a "huge portion of the internet." Cloudflare's internal systems degraded due to a configuration or database schema mismatch during a software rollout, triggering panic in shared mutable state initialization. This wasn't a cyberattack but a classic case of human error amplified by scale—think of it as deploying a patch that accidentally locks the front door while everyone's inside.
Affected services spanned the board: the Cloudflare Dashboard saw intermittent login failures, Access and WARP clients reported elevated error rates (with WARP temporarily disabled in London during fixes), and application services like DNS resolution and content delivery faltered globally. High-profile casualties included X, where thousands of users couldn't load feeds, and OpenAI's ChatGPT, which became unreachable for many. The disruption lasted about eight hours, with full resolution by 19:28 UTC after deploying a rollback and monitoring fixes.
Cloudflare's transparency in their post-mortem is commendable, but the event underscores how even giants aren't immune. For businesses, it was a costly lesson in third party dependency and not having enough confidence on the service being resilient.
How Can Your Business Be affected?
You may be depending on service providers like Cloudflare for handling DNS, DDoS protection, and edge caching. When they hiccup, the fallout is immediate and far-reaching:
- Revenue Loss: Online retailers like Shopify stores or Amazon affiliates saw carts abandoned mid-checkout. A single hour of downtime can cost mid-sized e-commerce businesses $10,000–$100,000 in lost sales, per industry benchmarks.
- User Experience Degradation: Streaming services buffered endlessly, social platforms froze, and collaboration tools like Slack integrations failed, eroding trust. Frustrated users churn—studies show a 7% drop in conversions per second of delay.
- Operational Chaos: DevOps teams scrambled with alerts firing, while customer support lines lit up. For global firms, the staggered impact across time zones meant 24/7 firefighting.
- Long-Term Hits: SEO rankings dip from crawl errors, and compliance headaches arise if SLAs are breached. In regulated sectors like finance or healthcare, this could trigger audits or fines.
This outage hit during peak hours for Europe and the Americas, amplifying the pain for businesses already stretched thin post-pandemic. It's a reminder: your uptime is only as strong as your weakest link.
Recommended Resilience Architecture For Your Business Services
Staying resilient doesn't require reinventing the wheel—just smart layering. Here are five battle-tested practices, each with a quick how-to:
1. Multi-Provider Redundancy: Don't put all eggs in one basket. Route traffic through alternatives like Akamai or Fastly for failover. Tip: Use anycast DNS to auto-switch providers in under 60 seconds.
2. Aggressive Caching and Edge Computing: Pre-load static assets at the edge to survive backend blips. Tip: Implement immutable caching with TTLs of 24+ hours for non-volatile content.
3. Robust Monitoring and Alerting: Tools like Datadog, Dynatrace or Prometheus can detect anomalies early. Tip: Set up synthetic monitors that simulate user journeys, alerting on >1% error rates.
4. Graceful Degradation and Offline Modes: Design apps to work partially offline—queue actions for retry. Tip: Use service workers in PWAs to cache critical paths.
These aren't silver bullets, but combined, they can cut recovery time from hours to minutes.
Cloudflare also must be doing everything that is possible to stay resilient. However, small failures either in the infrastructure, or applications or third party dependencies are inevitable. Your services must continue to stay resilient against potential failures. How? The answer lies in verifying as frequently as possible that your business services are resilient and if not, keep making corrections.

Why Is Regular Resilience Testing Non-Negotiable?
Outages like Cloudflare's expose the "unknown unknowns"—flaws that only surface under stress. Regular testing flips the script: instead of reactive firefighting, you're proactive architects.
Even though you have architected and implemented the good practices for resilience, there are lot of variables which can change your resiliency assumptions.
- Code changes are deployed and software is updated on your application or underlying infrastructure clusters.
- Configurations/behavior of the underlying infrastructure is updated. E.g: One of the services is moved from one VM to another VM with a lower configuration.
- New dependent services are introduced.
Unless you have enough resilience testing coverage with every change, you always will have unknown unknowns. With known unknowns, you at least have a tested mechanism on how to respond and recovery quickly.
Harness Chaos Engineering Strengthens Your Resilience Posture
- Network Latency and Packet Loss: Mimic DNS resolution delays or edge routing fails. Probe how your app handles 500ms+ lags—perfect for testing failover to secondary CDNs.
- Service Outage Simulation: "Kill" external dependencies like API calls to Cloudflare services. Use resilience probes to verify if your system auto-retries or degrades gracefully.
- Resource Contention Faults: Stress CPU/memory to echo overload from traffic spikes. ChaosGuard ensures experiments stay within guardrails, preventing cascade failures.
- Pod/Node Terminations (for K8s Users): Randomly evict resources to test scaling. Integrate with GitOps for automated rollbacks if thresholds breach.
- File or Disk size increases: Increase the files size, fill the underly disks or fill the database tables with fillers. Use resilience probes to verify if other services are functional. In the case of the Cloudflare outage, the root cause on their side appears to be increased file size or database changes, which might have been averted with regular resilience testing practice.
These aren't one-offs; run them in steady-state probes for baseline metrics, then blast radius tests for full-system validation. With AI-driven insights, Harness flags weak spots pre-outage—like over-reliance on a single provider—and suggests fixes. Early adopters report 30% uptime gains and halved incident severity.
Harness Chaos Engineering provides hundreds of ready to use fault templates to create required faulty scenarios and integrations with your APM systems to verify the resilience of your business services. The created chaos experiments are easy to add to either your deployment piplelines like Harness CD, GitLab, GitHub actions or to your GameDays.

Ready To Outage-Proof Your Business?
The Cloudflare outage was a global gut-check, but it's also an opportunity. By auditing dependencies today and layering in resilience practices—capped with tools like Harness—you'll sleep better knowing your services can weather the storm.
What's your first step? Audit your Cloudflare integrations or spin up a quick chaos experiment. Head to our Chaos Engineering page to learn more or sign up for our free tier with all the features that only limits the number of chaos experiments you can run in a month.
If you wish to learn more about resilience testing practices using Harness, this article will help.
Are you ready to outage-proof your business? Let's build a more unbreakable internet together, one test at a time.

Automating Chaos Engineering with Terraform
Infrastructure as Code (IaC) has revolutionized how we manage and provision infrastructure. But what about chaos engineering? Can you automate the setup of your chaos experiments the same way you provision your infrastructure?
The answer is yes. In this guide, I'll walk you through how to integrate Harness Chaos Engineering into your infrastructure using Terraform, making it easier to maintain resilient systems at scale.
Why Automate Chaos Engineering?
Before diving into the technical details, let's talk about why this matters.
Managing chaos engineering manually across multiple environments is time-consuming and error-prone. You need to set up infrastructures, configure service discovery, manage security policies, and maintain consistency across dev, staging, and production environments.
With Terraform, you can:
- Version control your entire chaos engineering setup
- Replicate configurations across environments reliably
- Integrate chaos engineering into your existing IaC workflows
- Collaborate with your team using familiar tools
What You Can Automate
The Harness Terraform provider lets you automate several key aspects of chaos engineering:
Infrastructure Setup - Enable chaos engineering on your existing Kubernetes clusters or provision new ones with chaos capabilities built in.
Service Discovery - Automatically detect services that can be targeted for chaos experiments, eliminating manual configuration.
Image Registries - Configure custom image registries for your chaos experiment workloads, giving you control over where container images are pulled from.
Security Governance - Define and enforce policies that control when and how chaos experiments can run, particularly important for production environments.
ChaosHub Management - Manage repositories of reusable chaos experiments, probes, and actions at the organization or project level.
Getting Started
Before you begin, make sure you have:
- Terraform installed and configured
- The Harness Terraform provider set up (see the official documentation)
- A Kubernetes infrastructure where you want to enable chaos engineering
Currently, the Harness Terraform provider for chaos engineering supports Kubernetes infrastructures.
Building Your Configuration
Let's walk through the key resources you'll need.
Setting Up Common Configuration
Start by defining common variables that will be used across all your resources:
locals {
  org_id = var.org_identifier != null ? var.org_identifier : harness_platform_organization.this[0].id

  project_id = var.project_identifier != null ? var.project_identifier : (
    var.org_identifier != null ? "${var.org_identifier}_${replace(lower(var.project_name), " ", "_")}" :
    "${harness_platform_organization.this[0].id}_${replace(lower(var.project_name), " ", "_")}"
  )

  common_tags = merge(
    var.tags,
    {
      "module" = "harness-chaos-engineering"
    }
  )

  tags_set = [for k, v in local.common_tags : "${k}=${v}"]
}
This approach keeps your configuration DRY and makes it easy to reference organization and project identifiers throughout your setup.
Creating Organization and Project
If you don't have an existing organization or project, Terraform can create them:
resource "harness_platform_organization" "this" {
  count       = var.org_identifier == null ? 1 : 0
  identifier  = replace(lower(var.org_name), " ", "_")
  name        = var.org_name
  description = "Organization for Chaos Engineering"
  tags        = local.tags_set
}

resource "harness_platform_project" "this" {
  depends_on = [harness_platform_organization.this]

  count       = var.project_identifier == null ? 1 : 0
  org_id      = local.org_id
  identifier  = local.project_id
  name        = var.project_name
  color       = var.project_color
  description = "Project for Chaos Engineering"
  tags        = local.tags_set
}
Setting Up Kubernetes Connector
Connect your Kubernetes cluster to Harness:
resource "harness_platform_connector_kubernetes" "this" {
  depends_on = [harness_platform_project.this]

  identifier = var.k8s_connector_name
  name       = var.k8s_connector_name
  org_id     = local.org_id
  project_id = local.project_id

  inherit_from_delegate {
    delegate_selectors = var.delegate_selectors
  }

  tags = local.tags_set
}
Creating Environment and Infrastructure
Set up your environment and infrastructure definition:
resource "harness_platform_environment" "this" {
  depends_on = [
    harness_platform_project.this,
    harness_platform_connector_kubernetes.this
  ]

  identifier = var.environment_identifier
  name       = var.environment_name
  org_id     = local.org_id
  project_id = local.project_id
  type       = "PreProduction"

  tags = local.tags_set
}

resource "harness_platform_infrastructure" "this" {
  depends_on = [
    harness_platform_environment.this,
    harness_platform_connector_kubernetes.this
  ]

  identifier      = var.infrastructure_identifier
  name            = var.infrastructure_name
  org_id          = local.org_id
  project_id      = local.project_id
  env_id          = harness_platform_environment.this.id
  deployment_type = var.deployment_type
  type            = "KubernetesDirect"

  yaml = <<-EOT
  infrastructureDefinition:
    name: ${var.infrastructure_name}
    identifier: ${var.infrastructure_identifier}
    orgIdentifier: ${local.org_id}
    projectIdentifier: ${local.project_id}
    environmentRef: ${harness_platform_environment.this.id}
    type: KubernetesDirect
    deploymentType: ${var.deployment_type}
    allowSimultaneousDeployments: false
    spec:
      connectorRef: ${var.k8s_connector_name}
      namespace: ${var.namespace}
      releaseName: release-${var.infrastructure_identifier}
  EOT

  tags = local.tags_set
}
Enabling Chaos Infrastructure
Now enable chaos engineering capabilities on your infrastructure:
resource "harness_chaos_infrastructure_v2" "this" {
  depends_on = [harness_platform_infrastructure.this]

  org_id         = local.org_id
  project_id     = local.project_id
  environment_id = harness_platform_environment.this.id
  infra_id       = harness_platform_infrastructure.this.id
  name           = var.chaos_infra_name
  description    = var.chaos_infra_description

  namespace  = var.chaos_infra_namespace
  infra_type = var.chaos_infra_type

  ai_enabled           = var.chaos_ai_enabled
  insecure_skip_verify = var.chaos_insecure_skip_verify

  service_account = var.service_account_name
  tags            = local.tags_set
}
Automating Service Discovery
Service discovery eliminates the need to manually register services for chaos experiments:
resource "harness_service_discovery_agent" "this" {
  depends_on = [harness_chaos_infrastructure_v2.this]

  name                   = var.service_discovery_agent_name
  org_identifier         = local.org_id
  project_identifier     = local.project_id
  environment_identifier = harness_platform_environment.this.id
  infra_identifier       = harness_platform_infrastructure.this.id
  installation_type      = var.sd_installation_type

  config {
    kubernetes {
      namespace = var.sd_namespace
    }
  }
}
Once deployed, the agent will automatically detect services running in your cluster, making them available for chaos experiments.
Configuring Custom Image Registries
For organizations that use private registries or have specific image sourcing requirements, you can configure custom image registries at both organization and project levels:
resource "harness_chaos_image_registry" "org_level" {
  depends_on = [harness_platform_organization.this]

  count = var.setup_custom_registry ? 1 : 0

  org_id = local.org_id

  registry_server  = var.registry_server
  registry_account = var.registry_account

  is_default          = var.is_default_registry
  is_override_allowed = var.is_override_allowed
  is_private          = var.is_private_registry
  secret_name         = var.registry_secret_name != "" ? var.registry_secret_name : null

  use_custom_images = var.use_custom_images
  dynamic "custom_images" {
    for_each = var.use_custom_images ? [1] : []
    content {
      log_watcher = var.log_watcher_image != "" ? var.log_watcher_image : null
      ddcr        = var.ddcr_image != "" ? var.ddcr_image : null
      ddcr_lib    = var.ddcr_lib_image != "" ? var.ddcr_lib_image : null
      ddcr_fault  = var.ddcr_fault_image != "" ? var.ddcr_fault_image : null
    }
  }
}

resource "harness_chaos_image_registry" "project_level" {
  depends_on = [harness_chaos_image_registry.org_level]

  count = var.setup_custom_registry ? 1 : 0

  org_id     = local.org_id
  project_id = local.project_id

  registry_server  = var.registry_server
  registry_account = var.registry_account

  is_default          = var.is_default_registry
  is_override_allowed = var.is_override_allowed
  is_private          = var.is_private_registry
  secret_name         = var.registry_secret_name != "" ? var.registry_secret_name : null

  use_custom_images = var.use_custom_images
  dynamic "custom_images" {
    for_each = var.use_custom_images ? [1] : []
    content {
      log_watcher = var.log_watcher_image != "" ? var.log_watcher_image : null
      ddcr        = var.ddcr_image != "" ? var.ddcr_image : null
      ddcr_lib    = var.ddcr_lib_image != "" ? var.ddcr_lib_image : null
      ddcr_fault  = var.ddcr_fault_image != "" ? var.ddcr_fault_image : null
    }
  }
}
Setting Up Git Connector for ChaosHub
To manage your chaos experiments in Git repositories, first create a Git connector:
resource "harness_platform_connector_git" "chaos_hub" {
  depends_on = [
    harness_platform_organization.this,
    harness_platform_project.this
  ]

  count = var.create_git_connector ? 1 : 0

  identifier      = replace(lower(var.git_connector_name), " ", "-")
  name            = var.git_connector_name
  description     = "Git connector for Chaos Hub"
  org_id          = local.org_id
  project_id      = local.project_id
  url             = var.git_connector_url
  connection_type = "Account"

  dynamic "credentials" {
    for_each = var.git_connector_ssh_key != "" ? [1] : []
    content {
      ssh {
        ssh_key_ref = var.git_connector_ssh_key
      }
    }
  }

  dynamic "credentials" {
    for_each = var.git_connector_ssh_key == "" ? [1] : []
    content {
      http {
        username     = var.git_connector_username != "" ? var.git_connector_username : null
        password_ref = var.git_connector_password != "" ? var.git_connector_password : null

        dynamic "github_app" {
          for_each = var.github_app_id != "" ? [1] : []
          content {
            application_id  = var.github_app_id
            installation_id = var.github_installation_id
            private_key_ref = var.github_private_key_ref
          }
        }
      }
    }
  }

  validation_repo = var.git_connector_validation_repo

  tags = merge(
    { for k, v in var.chaos_hub_tags : k => v },
    {
      "managed_by" = "terraform"
      "purpose"    = "chaos-hub-git-connector"
    }
  )
}
This connector supports multiple authentication methods including SSH keys, HTTP credentials, and GitHub Apps, making it flexible for different Git hosting providers.
Managing ChaosHubs
ChaosHubs let you create libraries of reusable chaos experiments:
resource "harness_chaos_hub" "this" {
  depends_on = [harness_platform_connector_git.chaos_hub]

  count = var.create_chaos_hub ? 1 : 0

  org_id      = local.org_id
  project_id  = local.project_id
  name        = var.chaos_hub_name
  description = var.chaos_hub_description

  connector_id    = var.create_git_connector ? one(harness_platform_connector_git.chaos_hub[*].id) : var.chaos_hub_connector_id
  repo_branch     = var.chaos_hub_repo_branch
  repo_name       = var.chaos_hub_repo_name
  is_default      = var.chaos_hub_is_default
  connector_scope = var.chaos_hub_connector_scope

  tags = var.chaos_hub_tags

  lifecycle {
    ignore_changes = [tags]
  }
}
The configuration intelligently uses either a newly created Git connector or an existing one based on your variables, providing flexibility in how you manage your infrastructure.
Implementing Security Governance
This is where things get interesting. Chaos Guard lets you define rules that control chaos experiment execution.
First, create conditions that define what you want to control:
resource "harness_chaos_security_governance_condition" "this" {
  depends_on = [
    harness_platform_environment.this,
    harness_platform_infrastructure.this,
    harness_chaos_infrastructure_v2.this,
  ]

  name        = var.security_governance_condition_name
  description = "Condition to block destructive experiments"
  org_id      = local.org_id
  project_id  = local.project_id
  infra_type  = var.security_governance_condition_infra_type

  fault_spec {
    operator = var.security_governance_condition_operator

    dynamic "faults" {
      for_each = var.security_governance_condition_faults
      content {
        fault_type = faults.value.fault_type
        name       = faults.value.name
      }
    }
  }

  dynamic "k8s_spec" {
    for_each = var.security_governance_condition_infra_type == "KubernetesV2" ? [1] : []
    content {
      infra_spec {
        operator  = var.security_governance_condition_infra_operator
        infra_ids = ["${harness_platform_environment.this.id}/${harness_chaos_infrastructure_v2.this.id}"]
      }

      dynamic "application_spec" {
        for_each = var.security_governance_condition_application_spec != null ? [1] : []
        content {
          operator = var.security_governance_condition_application_spec.operator

          dynamic "workloads" {
            for_each = var.security_governance_condition_application_spec.workloads
            content {
              namespace = workloads.value.namespace
              kind      = workloads.value.kind
            }
          }
        }
      }

      dynamic "chaos_service_account_spec" {
        for_each = var.security_governance_condition_service_account_spec != null ? [1] : []
        content {
          operator         = var.security_governance_condition_service_account_spec.operator
          service_accounts = var.security_governance_condition_service_account_spec.service_accounts
        }
      }
    }
  }

  dynamic "machine_spec" {
    for_each = contains(["Windows", "Linux"], var.security_governance_condition_infra_type) ? [1] : []
    content {
      infra_spec {
        operator  = var.security_governance_condition_infra_operator
        infra_ids = var.security_governance_condition_infra_ids
      }
    }
  }

  lifecycle {
    ignore_changes = [name]
  }

  tags = [
    for k, v in merge(
      local.common_tags,
      {
        "platform" = lower(var.security_governance_condition_infra_type)
      }
    ) : "${k}=${v}"
  ]
}
This configuration supports multiple infrastructure types including Kubernetes, Windows, and Linux, with specific specifications for each platform type.
Then, create rules that apply these conditions with specific actions:
resource "harness_chaos_security_governance_rule" "this" {
  depends_on = [harness_chaos_security_governance_condition.this]

  name          = var.security_governance_rule_name
  description   = var.security_governance_rule_description
  org_id        = local.org_id
  project_id    = local.project_id
  is_enabled    = var.security_governance_rule_is_enabled

  condition_ids  = [harness_chaos_security_governance_condition.this.id]
  user_group_ids = var.security_governance_rule_user_group_ids

  dynamic "time_windows" {
    for_each = var.security_governance_rule_time_windows
    content {
      time_zone  = time_windows.value.time_zone
      start_time = time_windows.value.start_time
      duration   = time_windows.value.duration

      dynamic "recurrence" {
        for_each = time_windows.value.recurrence != null ? [time_windows.value.recurrence] : []
        content {
          type  = recurrence.value.type
          until = recurrence.value.until
        }
      }
    }
  }

  lifecycle {
    ignore_changes = [name]
  }

  tags = [
    for k, v in merge(
      local.common_tags,
      {
        "platform" = lower(var.security_governance_condition_infra_type)
      }
    ) : "${k}=${v}"
  ]
}
This setup ensures that certain types of chaos experiments require approval or are blocked entirely in production environments, giving you confidence to enable chaos engineering without fear of accidental damage. You can also configure time windows for when experiments are allowed to run.
What Happens After Deployment
Once you've applied your Terraform configuration:
- Your service discovery agent starts detecting applications in your configured environments automatically
- Your security governance rules are active, controlling how chaos experiments can be executed
- Your custom ChaosHubs are synchronized and available for use
- Custom image registries are configured if you're using private registries
At this point, you can use the Harness UI to create and configure specific chaos experiments, then execute them against your discovered services. The infrastructure and governance layer is handled by Terraform, while the experiment design remains flexible and can be adjusted through the UI.
Putting It All Together
Here's a practical example of what a complete module structure might look like:
module "chaos_engineering" {
  source = "./modules/chaos-engineering"

  # Organization and Project
  org_identifier     = "my-org"
  project_identifier = "production"

  # Infrastructure
  environment_id    = "prod-k8s"
  infrastructure_id = "k8s-cluster-01"
  namespace         = "default"

  # Chaos Infrastructure
  chaos_infra_name      = "prod-chaos-infra"
  chaos_infra_namespace = "harness-chaos"
  chaos_ai_enabled      = true

  # Service Discovery
  service_discovery_agent_name = "prod-service-discovery"
  sd_namespace                 = "harness-delegate-ng"

  # Custom Registry (optional)
  setup_custom_registry = true
  registry_server       = "my-registry.io"
  registry_account      = "chaos-experiments"
  is_private_registry   = true

  # Git Connector for ChaosHub
  create_git_connector   = true
  git_connector_name     = "chaos-experiments-git"
  git_connector_url      = "https://github.com/myorg/chaos-experiments"
  git_connector_username = "myuser"
  git_connector_password = "account.github_token"

  # ChaosHub
  create_chaos_hub      = true
  chaos_hub_name        = "production-experiments"
  chaos_hub_repo_branch = "main"
  chaos_hub_repo_name   = "chaos-experiments"

  # Security Governance
  security_governance_condition_name = "block-destructive-faults"
  security_governance_condition_faults = [
    {
      fault_type = "pod-delete"
      name       = "pod-delete"
    }
  ]

  security_governance_rule_name         = "production-safety-rule"
  security_governance_rule_user_group_ids = ["platform-team"]
  security_governance_rule_is_enabled   = true

  # Tags
  tags = {
    environment = "production"
    managed_by  = "terraform"
    team        = "platform"
  }
}
Best Practices
As you build out your chaos engineering automation, keep these practices in mind:
Start with non-production environments - Test your Terraform configurations and governance rules in development or staging before rolling out to production.
Use separate state files - Maintain separate Terraform state files for different environments to prevent accidental cross-environment changes.
Version your chaos experiments - Store experiment definitions in Git repositories and reference them through ChaosHubs for better collaboration and change tracking.
Leverage conditional resource creation - Use count parameters to optionally create resources like custom registries or Git connectors based on your needs.
Implement proper authentication - Use Harness secrets management for storing sensitive credentials like registry passwords and Git authentication tokens.
Review governance rules regularly - As your understanding of system resilience grows, update your governance conditions and rules to reflect new insights.
Use time windows strategically - Configure governance rules with time windows to allow experiments only during business hours or maintenance windows.
Tag everything - Proper tagging helps with cost tracking, resource management, and understanding relationships between resources.
Combine with CI/CD - Integrate your chaos engineering Terraform configurations into your CI/CD pipelines for fully automated infrastructure deployment.
Moving Forward
Automating chaos engineering with Terraform removes friction from adopting resilience testing practices. You can now treat your chaos engineering setup like any other infrastructure component, with version control, code review, and automated deployment.
The key is starting small. Pick one environment, set up the basic infrastructure and service discovery, then gradually add governance rules and custom experiments as you learn what works for your systems.
For more details on specific resources and configuration options, check out the Harness Terraform Provider documentation.
What aspects of chaos engineering do you think would benefit most from automation in your organization?
Important Links:
New to Harness Chaos Engineering? Signup here.
Trying to find the documentation for Chaos Engineering? Go here: Chaos Engineering
Learn more: What is Terraform
Running Chaos Engineering on GKE Autopilot Just Got Easier
Google's GKE Autopilot provides fully managed Kubernetes without the operational overhead of node management, security patches, or capacity planning. However, running chaos engineering experiments on Autopilot has been challenging due to its security restrictions.
We've solved that problem.
Why This Matters
Chaos engineering helps you identify issues before they impact your users. The approach involves intentionally introducing controlled failures to understand how your system responds. Think of it as a fire drill for your infrastructure.
GKE Autopilot secures clusters by restricting many permissions, which is excellent for security. However, this made running chaos experiments difficult. You couldn't simply deploy Harness Chaos Engineering and begin testing.
That changes today.
What Changed
We collaborated with Google to add Harness Chaos Engineering to GKE Autopilot's official allowlist. This integration enables Harness to run chaos experiments while operating entirely within Autopilot's security boundaries.
No workarounds required. Just chaos engineering that works as expected.
How to Set It Up
1. Apply the Allowlist
First, you need to tell GKE Autopilot that Harness chaos workloads are okay to run. Copy this command:
kubectl apply -f - <<'EOF'
apiVersion: auto.gke.io/v1
kind: AllowlistSynchronizer
metadata:
  name: harness-chaos-allowlist-synchronizer
spec:
  allowlistPaths:
  - Harness/allowlists/chaos/v1.62/*
  - Harness/allowlists/service-discovery/v0.42/*
EOF
Then wait for it to be ready:
kubectl wait --for=condition=Ready allowlistsynchronizer/harness-chaos-allowlist-synchronizer --timeout=60s
That's it for the cluster configuration.
2. Enable Autopilot Mode in Harness
Next, configure Harness to work with GKE Autopilot. You have several options:
If you're setting up chaos for the first time, just use the 1-click chaos setup and toggle on "Use static name for configmap and secret" during setup.
If you already have infrastructure configured, go to Chaos Engineering > Environments, find your infrastructure, and enable that same toggle.
You can also set this up when creating a new discovery agent, or update an existing one in Project Settings > Discovery.
What You Can Test
You can run most of the chaos experiments you'd expect:
The integration supports a comprehensive range of chaos experiments:
Resource stress: Pod CPU Hog, Pod Memory Hog, Pod IO Stress, Disk Fill. These experiments help you understand how your pods behave under resource constraints.
Network chaos: Pod Network Latency, Pod Network Loss, Pod Network Corruption, Pod Network Duplication, Pod Network Partition, Pod Network Rate Limit. Production networks experience imperfections, and your application needs to handle them gracefully.
DNS problems: Pod DNS Error to disrupt resolution, Pod DNS Spoof to redirect traffic.
HTTP faults: Pod HTTP Latency, Pod HTTP Modify Body, Pod HTTP Modify Header, Pod HTTP Reset Peer, Pod HTTP Status Code. These experiments test how your APIs respond to unexpected behavior.
API-level chaos: Pod API Block, Pod API Latency, Pod API Modify Body, Pod API Modify Header, Pod API Status Code. Good for testing service mesh and gateway behavior.
File system chaos: Pod IO Attribute Override, Pod IO Error, Pod IO Latency, Pod IO Mistake. These experiments reveal how your application handles storage issues.
Container lifecycle: Container Kill and Pod Delete to test recovery. Pod Autoscaler to see if scaling works under pressure.
JVM chaos if you're running Java: Pod JVM CPU Stress, Pod JVM Method Exception, Pod JVM Method Latency, Pod JVM Modify Return, Pod JVM Trigger GC.
Database chaos for Java apps: Pod JVM SQL Exception, Pod JVM SQL Latency, Pod JVM Mongo Exception, Pod JVM Mongo Latency, Pod JVM Solace Exception, Pod JVM Solace Latency.
Cache problems: Redis Cache Expire, Redis Cache Limit, Redis Cache Penetration.
Time manipulation: Time Chaos to introduce controlled time offsets.
What This Means for You
If you're running GKE Autopilot and want to implement chaos engineering with Harness, you can now do both without compromise. There's no need to choose between Google's managed experience and resilience testing.
For teams new to chaos engineering, Autopilot provides an ideal starting point. The managed environment reduces infrastructure complexity, allowing you to focus on understanding application behavior under stress.
Getting Started
Start with a simple CPU stress test. Select a non-critical pod and run a low-intensity Pod CPU Hog experiment in Harness. Observe the results: Does your application degrade gracefully? Do your alerts trigger as expected? Does it recover when the experiment completes?
Start small, understand your system's behavior, then explore more complex scenarios.
You can configure Service Discovery to visualize your services in Application Maps, add probes to validate resilience during experiments, and progressively explore more sophisticated fault injection scenarios.
Check out the documentation for the complete setup guide and all supported experiments.
The goal of chaos engineering isn't to break things. It's to understand what breaks before it impacts your users.
.png)
Validating chaos experiments with GCP Cloud Monitoring probes
Running infrastructure on Google Cloud Platform means you're already collecting metrics through Cloud Monitoring. But here's the question: when you deliberately break things during chaos experiments, how do you know if your systems actually stayed healthy?
The GCP Cloud Monitoring probe in Harness Chaos Engineering answers this by letting you query your existing GCP metrics using PromQL and automatically validate them against your SLOs. No manual dashboard watching, no guessing whether that CPU spike was acceptable. Just automated, pass/fail validation of whether your infrastructure held up during controlled chaos.
The Challenge with GCP Infrastructure Testing
Here's a common scenario: you run a chaos experiment that kills pods in your GKE cluster. You watch your GCP Console, see some metrics fluctuate, and everything seems fine. But was it actually fine? Did CPU stay under 80%? Did memory pressure trigger any OOM kills? Did disk I/O queues grow beyond acceptable levels?
Without objective measurement, you're relying on gut feel. GCP Cloud Monitoring probes solve this by turning your existing monitoring into automated test assertions for chaos experiments.
The beauty is that you're already collecting these metrics. GCP Cloud Monitoring tracks everything from compute instance performance to Cloud Run request latency. These probes simply tap into that data stream during chaos experiments and validate it against your defined thresholds.
What You'll Need
Before configuring a GCP Cloud Monitoring probe, ensure you have:
- An active GCP account with Cloud Monitoring enabled for your project
- Network access to the GCP Cloud Monitoring API from your Kubernetes execution plane
- Either a chaos infrastructure with IAM and workload identity configured, or GCP service account credentials with the monitoring.timeSeries.list permission
The authentication flexibility here is powerful. If you've already set up workload identity for your chaos infrastructure, you can leverage those existing credentials. Otherwise, you can use a specific service account key for more granular control.
Setting Up Your GCP Cloud Monitoring Probe
Creating the Probe
Navigate to the Probes & Actions section in the Harness Chaos module and click New Probe. Select APM Probe, give it a descriptive name, and choose GCP Cloud Monitoring as the APM type.

Authentication: IAM or Service Account Keys?
One of the nice things about GCP Cloud Monitoring probes is the authentication flexibility. You get two options, and the right choice depends on your security posture and infrastructure setup.
Chaos Infra IAM with Workload Identity
If your chaos infrastructure already runs in GCP with workload identity configured, this is the path of least resistance. Your chaos pods inherit the service account permissions you've already set up. No additional secrets to manage, no credential rotation headaches. The probe just works using the existing IAM context.
This approach shines when you're running chaos experiments within the same GCP project (or organization) where your chaos infrastructure lives. It's also the more secure option since there's no long-lived credential sitting in a secret store.
GCP Service Account Keys
Sometimes you need more control. Maybe your chaos infrastructure runs outside GCP, or you want specific experiments to use different permission sets. That's where service account keys come in.
You create a dedicated service account with just the monitoring.timeSeries.list permission (usually through the Monitoring Viewer role), generate a JSON key, and store it in Harness Secret Manager. The probe authenticates using this key for each query.
The tradeoff is credential management. You're responsible for rotating these keys and ensuring they don't leak. But you gain the ability to run chaos from anywhere and fine-tune permissions per experiment type.
Defining Your Probe Logic
Once authentication is configured, specify what metrics to monitor and what constitutes success.
Setting Your Project Context
Enter your GCP project ID, which you can find in the GCP Console or extract from your project URL. This tells the probe which project's metrics to query. For example: my-production-project-123456.
Crafting Your PromQL Queries
GCP Cloud Monitoring speaks PromQL, which is good news if you're already familiar with Prometheus. The query structure is straightforward: metric name, resource labels for filtering, and time range functions for aggregation.
Let's say you're chaos testing a Compute Engine instance and want to ensure CPU doesn't exceed 80%. Your query might look like:
avg_over_time(compute.googleapis.com/instance/cpu/utilization{instance_name="my-instance"}[5m])
This averages CPU utilization over 5 minutes for a specific instance. The time window should match your chaos duration. If you're running a 5-minute experiment, query the 5-minute average.
For GKE workloads, you might monitor container memory usage across a cluster:
avg(container.googleapis.com/container/memory/usage_bytes{cluster_name="production-cluster"})
The metric path follows GCP's naming convention: service, resource type, then the specific metric. Resource labels let you filter to exactly the infrastructure under test.
Defining Pass/Fail Thresholds
Once you have your query, set the success criteria. Pick your data type (Float for percentages and ratios, Int for counts and bytes), choose a comparison operator, and set the threshold.
For that CPU query, you'd set: Type=Float, Operator=<=, Value=80. If CPU stays at or below 80% throughout the chaos, the probe passes. If it spikes to 85%, the probe fails, and your experiment fails.
Tuning Probe Behavior
The runtime properties control how aggressively the probe validates your metrics. Getting these right depends on your experiment characteristics and how quickly you expect problems to surface.
Interval and Timeout work together to create your validation cadence. Set interval to 5 seconds with a 10-second timeout, and the probe checks metrics every 5 seconds, allowing up to 10 seconds for each query to complete. GCP Cloud Monitoring is usually fast, but if you're querying large time ranges or hitting rate limits, increase the timeout.
Initial Delay is critical for chaos experiments where the impact isn't immediate. If you're gradually increasing load or waiting for cache invalidation, delay the first probe check by 30-60 seconds. No point in failing the probe before the chaos has actually affected anything.
Attempt and Polling Interval handle transient failures. Set attempts to 3 with a 5-second polling interval, and the probe retries up to 3 times with 5 seconds between attempts if a query fails. This handles temporary API throttling or network blips without marking your experiment as failed.
Stop On Failure is your circuit breaker. Enable it if you want the experiment to halt immediately when metrics exceed thresholds. This prevents prolonged disruption when you've already proven the system can't handle the chaos. Leave it disabled if you want to collect the full time series of how metrics degraded throughout the experiment.
Making GCP Metrics Actionable During Chaos
The real power of GCP Cloud Monitoring probes isn't just automation. It's turning passive monitoring into active validation. Your GCP metrics go from "interesting data to look at" to "the definitive measure of experiment success."
When a probe executes, it:
- Queries your GCP project's Cloud Monitoring data using the PromQL you defined
- Extracts the metric value from the time series results
- Evaluates it against your threshold (<=80%, >1000ms, etc.)
- Records a pass or fail for that check
- Aggregates all checks to influence the experiment's final verdict
This creates an audit trail. You can prove that during the January 15th chaos experiment, CPU never exceeded 75% even when you killed 30% of pods. Or you can show that the December deployment broke something because memory usage spiked to 95% during the same test that passed in November.
That historical data becomes valuable for capacity planning, SLO refinement, and arguing for infrastructure budget. You're not just doing chaos for chaos's sake. You're building a quantitative understanding of your system's limits.
Start with Your Dashboard Metrics
The easiest way to begin using GCP Cloud Monitoring probes is to look at your existing dashboards. What metrics do you check during incidents? CPU, memory, request latency, error rates? Those are your probe candidates.
Pick one critical metric, write a PromQL query for it, set a reasonable threshold, and add it to your next chaos experiment. Run the experiment. See if the probe passes or fails. Adjust the threshold if needed based on what you learn.
Over time, you'll build a suite of probes that comprehensively validate your infrastructure's resilience. And because these probes use your existing GCP monitoring data, there's no additional instrumentation burden. You're just making better use of what you already collect.
Remember, the goal of chaos engineering is learning. GCP Cloud Monitoring probes accelerate that learning by giving you objective, repeatable measurements of how your systems behave under failure conditions. And objective measurements beat subjective observations every time.

Load Testing at Scale: Understanding Locust Loadgen in Harness Chaos Engineering
When it comes to building resilient applications, one of the most critical questions you need to answer is this: how will your system perform under heavy load? That's where the Locust loadgen fault in Harness Chaos Engineering comes into play. This powerful chaos experiment helps you simulate realistic load conditions and uncover potential bottlenecks before they impact your users.
What is Locust Loadgen?
Locust loadgen is a chaos engineering fault that simulates heavy traffic on your target hosts for a specified duration. Think of it as a stress test that pushes your applications to their limits in a controlled environment. The fault leverages Locust, a popular open-source load testing tool, to generate realistic user traffic patterns.
The primary goals are straightforward yet crucial. You're stressing your infrastructure by simulating heavy load that could slow down or make your target host unavailable. You're evaluating application performance by observing how your services behave under pressure. And you're measuring recovery time to understand how quickly your systems bounce back after experiencing load-induced failures.
Why Load Testing Matters in Chaos Engineering
Load-related failures are among the most common causes of production incidents. A sudden spike in traffic, whether from a successful marketing campaign or an unexpected viral moment, can bring even well-architected systems to their knees. The Locust loadgen fault helps you answer critical questions.
Can your application handle Black Friday levels of traffic? How does your system degrade when pushed beyond its designed capacity? What's your actual recovery time when load subsides? Where are the weak points in your infrastructure that need reinforcement?
By proactively testing these scenarios, you can identify and fix issues before they affect real users.
Getting Started Prerequisites
Before you can start injecting load chaos into your environment, you'll need a few things in place.
You'll need Kubernetes version 1.17 or higher. This is the foundation that runs your chaos experiments. Make sure your target application or service is reachable from within your Kubernetes cluster.
Here's where things get interesting. You'll need a Kubernetes ConfigMap containing a config.py file that defines your load testing behavior. This file acts as the blueprint for how Locust generates traffic.
Here's a basic example of what that ConfigMap looks like:
apiVersion: v1
kind: ConfigMap
metadata:
  name: load
  namespace: <CHAOS-NAMESPACE>
data:
  config.py: |
    import time
    from locust import HttpUser, task, between

    class QuickstartUser(HttpUser):
        wait_time = between(1, 5)

        @task
        def hello_world(self):
            self.client.get("")
Configuring Your Load Test
The beauty of the Locust loadgen fault lies in its flexibility. Let's walk through the key configuration options that control your chaos experiment.
Target Host
The HOST parameter specifies which application or service you want to test. This is mandatory and could be an internal service URL, an external website, or any HTTP endpoint you need to stress test:
- name: HOST
  value: "https://www.google.com"
Chaos Duration
The TOTAL_CHAOS_DURATION parameter controls how long the load generation runs. The default is 60 seconds, but you should adjust this based on your testing needs. For instance, if you're testing autoscaling behavior, you might want a longer duration to observe scale-up and scale-down events:
- name: TOTAL_CHAOS_DURATION
  value: "120"
Number of Users
The USERS parameter defines how many concurrent users Locust will simulate. This is perhaps one of the most important tuning parameters. Start conservatively and gradually increase to find your system's breaking point:
- name: USERS
  value: "100"
Spawn Rate
The SPAWN_RATE parameter controls how quickly users are added to the test. Rather than hitting your system with 100 users instantly, you might spawn them at 10 users per second, giving you a more realistic ramp-up scenario:
- name: SPAWN_RATE
  value: "10"
Custom Load Image
For advanced use cases, you can provide a custom Docker image containing specialized Locust configurations using the LOAD_IMAGE parameter:
- name: LOAD_IMAGE
  value: "chaosnative/locust-loadgen:latest"
Seeing It in Action
The real power of the Locust loadgen fault becomes evident when you combine it with observability tools like Grafana. When you run the experiment, you can watch in real-time as your metrics respond to the load surge.
Here's what a complete experiment configuration looks like in practice:
apiVersion: litmuschaos.io/v1alpha1
kind: KubernetesChaosExperiment
metadata:
  name: locust-loadgen-on-frontend
  namespace: harness-delegate-ng
spec:
  cleanupPolicy: delete
  experimentId: d5d1f7d5-8a98-4a77-aca3-45fb5c984170
  serviceAccountName: litmus
  tasks:
    - definition:
        chaos:
          components:
            configMaps:
              - mountPath: /tmp/load
                name: load
          env:
            - name: TOTAL_CHAOS_DURATION
              value: "60"
            - name: USERS
              value: "30"
            - name: SPAWN_RATE
              value: "1000"
            - name: HOST
              value: http://your-load-balancer-url.elb.amazonaws.com
            - name: CONFIG_MAP_FILE
              value: /tmp/load/config.py
          experiment: locust-load-generator
          image: docker.io/harness/chaos-ddcr-faults:1.55.0
      name: locust-loadgen-chaos
      probeRef:
        - mode: OnChaos
          probeID: app-latency-check
        - mode: OnChaos
          probeID: number-of-active-requests
        - mode: Edge
          probeID: app-health-check
Notice how this experiment includes probe references. These probes run during the chaos experiment to validate different aspects of your system's behavior, like latency checks, active request counts, and overall health status.
Monitoring the Impact in Grafana
When you run this experiment and monitor your application in Grafana, you'll see the surge immediately. Your dashboards will show operations per second graphs spiking as Locust generates load, access duration metrics increasing as your services come under pressure, request counts climbing across your frontend, cart, and product services, and response times varying as the system adapts to the load.
The beauty of this approach is that you're not just generating load blindly. You're watching how every layer of your application stack responds. You might see your frontend service handling the initial surge well, while your cart service starts showing increased latency. These insights are invaluable for capacity planning and optimization.
Integrating with Chaos Probes
The experiment configuration includes three types of probes that run during chaos.
OnChaos Probes run continuously during the chaos period. In this example, they monitor application latency and the number of active requests. If latency exceeds your SLA thresholds or request counts drop unexpectedly, the probe will catch it.
Edge Probes run at the beginning and end of the experiment. The health check probe ensures your application is healthy before chaos starts and verifies it recovers properly afterward.
This combination of load generation and continuous validation gives you confidence that you're not just surviving the load, but maintaining acceptable performance throughout.
Permissions Required
Security is paramount in any Kubernetes environment. The Locust loadgen fault requires specific RBAC permissions to function properly. Here are the key permissions needed.
You need pod management permissions to create, delete, and list pods for running the load generation. Job management allows you to create and manage Kubernetes jobs that execute the load tests. Event access lets you record and retrieve events for observability. ConfigMap and secret access enables reading configuration data and sensitive information. And chaos resource access allows interaction with ChaosEngines, ChaosExperiments, and ChaosResults.
These permissions should be scoped to the namespace where your chaos experiments run, following the principle of least privilege. The documentation provides a complete RBAC role definition that you can use as a starting point and adjust based on your security requirements.
Best Practices for Load Testing with Locust Loadgen
Start small and scale up. Don't immediately test with production-level loads. Start with a small number of users and gradually increase to understand your system's capacity curve.
Monitor everything. During the chaos experiment, keep a close eye on your application metrics, infrastructure metrics, and logs. The insights you gain are just as important as whether the system stays up.
Test in non-production first. Always validate your chaos experiments in staging or testing environments before running them in production. This helps you understand the fault's impact and refine your configuration.
Customize your load patterns. The default configuration is a starting point. Modify the config.py file to match your actual user behavior patterns for more realistic testing.
Consider time windows. If you do run load tests in production, use the ramp time features to schedule them during low-traffic periods.
Measuring Success
A successful load test isn't just about whether your application survives. Look for response time degradation and how response times change as load increases. Watch error rates to identify at what point errors start appearing. Monitor resource utilization to see if you're efficiently using CPU, memory, and network resources. Observe autoscaling behavior to confirm your horizontal pod autoscalers kick in at the right time. And measure recovery time to understand how long it takes for your system to return to normal once the load subsides.
Wrapping Up
The Locust loadgen fault in Harness Chaos Engineering gives you a powerful tool for understanding how your applications behave under stress. By regularly testing your systems with realistic load patterns and monitoring the results in tools like Grafana, you can identify weaknesses, validate capacity planning, and build confidence in your infrastructure's resilience.
Remember, chaos engineering isn't about breaking things for the sake of it. It's about learning how your systems fail so you can prevent those failures from impacting your users. Load testing with Locust loadgen, combined with continuous monitoring and validation through probes, is an essential part of that journey.
Ready to start your load testing journey? Configure your first Locust loadgen experiment, set up your Grafana dashboards, and watch how your applications respond to pressure. The insights you gain will be invaluable for building truly resilient systems.
Important Links:
New to Harness Chaos Engineering ? Signup here
Trying to find the documentation for Chaos Engineering ? Go here: Chaos Engineering
Want to build the Harness MCP server here ? Go here: GitHub
Want to know how to setup Harness MCP servers with Harness API Keys ? Go here: Manage API keys
Harness Celebrates Hacktoberfest with LitmusChaos
Every October the open-source world comes alive for Hacktoberfest, a month dedicated to contribution, mentorship, and community. This Hacktoberfest, Harness is celebrating alongside the LitmusChaos community: inviting contributors, opening curated issues, hosting office hours, and helping surface work that will feed into the upcoming Litmus 4.0 roadmap. If you’ve ever wanted to get involved in chaos engineering, this is your chance.
What is Hacktoberfest?
Hacktoberfest is DigitalOcean’s annual month-long celebration of open source where developers of every skill level contribute to public repositories and learn from maintainers and peers. Typical participation mechanics and rewards vary year to year (pull/merge request goals, swag, events), but the heart of Hacktoberfest is hands-on contribution and community support. If you’re new to open source, Hacktoberfest is a welcoming way to start.
What is LitmusChaos?
LitmusChaos is a community-driven, cloud-native chaos engineering platform for SREs and developers to validate resilience hypotheses by safely introducing failures and measuring system behavior. It’s a CNCF-incubated open-source project with an active GitHub, docs, and community channels.
Harness has been investing in chaos engineering and the Litmus ecosystem, bringing Litmus capabilities closer to enterprise customers while keeping community roots intact. Harness welcomed Litmus into the Harness family as part of that journey. Our goal is to help scale the project and amplify community contributions.
Litmus maintainers and contributors have been actively discussing and shaping a major next iteration (4.0) improvements. The community contributions during Hacktoberfest will be intentionally curated so that small fixes, experiments, docs, and tests can be picked up for the 4.0 milestone.
What we’re doing this Hacktoberfest?
- Curated issue lists: a mix of good-first-issues, docs improvements, test flake fixes, and features that map to Litmus 4.0 priorities. Look for labels like hacktoberfest / good-first-issue.
- Office hours & mentoring: weekly open sessions where Litmus maintainers help contributors get unblocked. Join our community to get invite.
- Recognition & community shoutouts: highlighting first-time contributors, helpful reviewers, and notable PRs.
How you can take part?
- Register for Hacktoberfest (if you want the official track and rewards) and read the participation rules.
- Browse Litmus repos (core, chaos-experiments, docs) and filter by hacktoberfest / good-first-issue. Jump on anything labeled for Hacktoberfest.
- Join office hours / community channels to ask maintainers for pairing help.
- Open your PR early and link it to the relevant issue; maintainers will help iterate, small PRs that are well described and testable are easiest to review and merge.
- Share your work on social channels and tag Harness/LitmusChaos, help grow the community.
Hacktoberfest is the perfect season to give back. For Litmus, the community’s contributions are the lifeblood of the project. For Harness, supporting those contributions means helping build a more resilient cloud-native future. If you’re curious about chaos engineering or Open source, there’s no better month than October to jump in.
Sources & further reading
Hacktoberfest info & how to participate (DigitalOcean).
LitmusChaos official site & docs.
Litmus GitHub (repos, labels, issues).
Litmus community and contributors meeting sneak peek.