
Resilience testing is an important part of your Software Development Life Cycle (SDLC) that measures and certifies that your business services remain reliable even when some parts of the system encounter problems temporarily. Measuring resilience under load is essential as new reliability issues come to light when faults occur under high system load. This article describes the procedure and best practices for resilience testing using the Grafana K6 load test tool and Harness Chaos Engineering’s chaos experiments. We take an example of an e-commerce application running on Kubernetes, but similar principles are applied to other environments, too.
In the real world, high traffic doesn’t arrive alone, it brings chaos with it.
Imagine your eCommerce site during a Black Friday sale. Users are flooding in, carts are filling up, and payment gateways are firing requests by the second. Your team has tested for load, and everything looks good in isolation. But what happens if the checkout service experiences latency, or the cart service pod restarts mid-transaction? Will customers still be able to check out? Will your system fail gracefully—or just fail?
This is where combining load testing with chaos engineering becomes critical.
Load testing validates performance under pressure. Chaos engineering ensures your app behaves reliably when key components fail, slow down, or misbehave—at the exact moment your system is under stress. By running both together, you move beyond just preparing for scale—you prepare for reality.
Let’s walk through a specific step by step guide!
Summary
Goal: Measure the resilience score of the Cart service under real-world load by injecting chaos experiments and tracking system health via resilience probes.
Sample Application: Boutique ECommerce Portal
Load Test Tool: Grafana K6, deployed locally at runtime.
Chaos Experiments: Network Loss, Network Latency, Pod Deletes, and HTTP API Status code errors.
Deployment and Test Setup

As shown above, the policies and experiments are configured on the control plane, and the constructed chaos experiments are sent to the target hosts or clusters on the execution plane. The first step is to get access to the Harness platform.
Get Access to the Platform
Sign up for a free Chaos Engineering on Harness plan that is fully featured and allows you to run a certain number of chaos experiments per month.
Otherwise, if you are a current Harness customer, someone (harness-account-admin) would have invited you to join an existing account at Harness that allows you access to the Chaos Engineering product.
Once you get access through either of the above methods, you can view/create and run chaos experiments along with the load tests. Before we get into the details of setting up and running the specific chaos experiments, it is essential to understand the roles and permissions required to do the proper setup.
We are considering three types of users for this resilience test setup.
- Harness Account Administrator (harness-acc-admin)
- Kubernetes and Application Administrator (service-admin)
- Application developer / Performance tester (service developer)
First, harness-acc-admin configures the required roles for the service developer to create and run the chaos experiments.
Second, the service admin must set up a service account on the target application cluster, which will be used to run the load generation and chaos experiments.
Once the above two roles and permissions are set up, you can create and run the chaos experiments and load generation tasks as an application developer, QA engineer, or performance tester.
Before showing the actual chaos experiments, let's explore the application and the test scenarios in more detail.
The Application and Test Scenario
OnlineBoutique is a sample application we will use in this resilience testing under load scenario. It consists of multiple microservices that interact with each other through simple APIs and store transaction data in a database. The architecture is shown below:

In the above diagram, the load generation is done using the Grafana K6 load generation tool. The OnlineBoutique can be set up on various platforms. In the current example, we have set up the application on a Kubernetes platform.
For resilience testing with Harness Chaos Engineering, the following two things are essential:
- Chaos faults and targets: This defines what chaos faults to be injected. In our examples, we will run a K6 load generator using one chaos experiment and run another parallel chaos experiment that does one of the following:
- Cause network latency between Checkout and PaymentServices
- Cause network loss between Frontend and CheckoutServices
- Injects an HTTP error code between Frontend and CartService
- Delete a pod on the ProductCatalog service
- The meaning of resilient state: In chaos engineering terminology, this is also called the "Steady State Hypothesis." In Harness Chaos Engineering, resilient states are defined using Resilience Probes. We are considering the following probes.
- Check if the queries per second on the frontend are less than 2000ms at any time.
- Check if the latency between the user and frontend is less than 20ms at any time.
- Check if the number of queries per second on the CartService is less than 1000ms at any time.
- Check if the pod replica count is the same (2) before and after the chaos execution.
- Check if the Kubernetes nodes are healthy during the chaos execution.
- Check if the latency between checkout and frontend is less than 20ms at any time.
- Check if the latency between the CartService and frontend is less than 20ms at any time.
Step-by-Step Guide
The first steps are signing up at Harness and connecting your application to the Harness control plane.

Step 1: Signup
Sign up at Harness to access the fully featured FREE Chaos Engineering plan. Alternatively, you may have received an invitation from someone in your organization who can access the Harness trail or enterprise plan.
In either case, identify your role and others with admin permissions on the Harness control plane and your application’s host/cluster.
Step 2: RBACs and Permissions

The Chaos Admin role is the easiest way to access the overall Chaos administrative functions. You should also have admin access to the target application cluster to set up the Harness Delegate in the next step, run chaos experiments, and load tests later.
Step 3: Setup a Delegate
Install the Harness Delegate on one of your Kubernetes clusters with network access to the cluster on which the application (in this case, the OnlineBoutique) is running. For help with the Delegate installation, see this link.
Step 4: Discover and Connect your Application
Harness Chaos Engineering provides an easy process for onboarding a chaos agent onto a Kubernetes cluster. Follow this link to discover the resources and automatically create basic chaos experiments.
Once the control and execution planes are set, specific steps for chaos experiments and load tests are followed.

Step 5: Create Resilience Probes
We are using three kinds of resilience probes:
- Prometheus probe to check the latency of the services.
- HTTP probe to check if a service is responding to the requests as expected.
- Command probe that is custom-written for checking the node and replica checks.
Example Prometheus Probe:
The Prometheus probe uses Prometheus query to compute the latency, as shown below.

name: boutique-frontend-latency-check
type: prom
ProbepromProbe/inputs:
	endpoint: http://XX.XX.XX.XX:9090/
  query: avg_over_time(probe_duration_seconds{job=\"prometheus-blackbox-exporter\",
  instance=\"frontend.boutique.svc.cluster.local:80\"}[60s:1s])*1000
  comparator:
  	type: float
    criteria: <=
    value: "50"
runProperties:
  probeTimeout: 10s
  interval: 2s
  attempt: 1
  probePollingInterval: 3s
  initialDelay: 1s
mode: Continuous
Example Command Probe:
A command probe that checks the number of pod replicas:

name: productcatalog-svc-replica-check
type: cmdProbe
cmdProbe/inputs:
	command: kubectl get pods -l app=productcatalogservice  -n    boutique  --no-headers | wc -l
  comparator:
  	type: float
    criteria: ==
    value: "1"
runProperties:
  	probeTimeout: 10s
    interval: 2s
    attempt: 1
    probePollingInterval: 3s
    initialDelay: 1s
mode: Continuous
The list of resilience probes for checking the resilient state of various services is shown below.

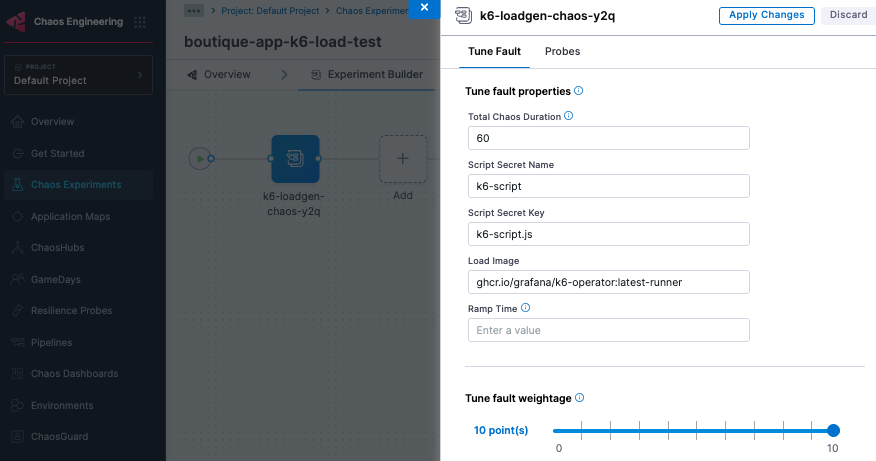
Step 6: Create K6 Load Experiment
The K6 load generator experiment is available as a native chaos fault in the Enterprise ChaosHub of Harness Chaos Engineering. It is configured for the load parameters, as shown below.
Step 7: Create chaos experiments for various scenarios
The chaos experiments required for test scenarios are constructed from the native chaos faults like:
- Network Latency
- Network Loss
- API Error Code and
- Pod Delete
The experiments are created using the above faults and tuning them for the targeted services such as Frontend, Checkout, and ProductCatalog in the OnlineBoutique All the resilience probes created above can be attached to each experiment so that the resilient state is checked with each experiment.

Step 8: Run the load test and chaos test in parallel
The Harness Chaos Engineering pipeline capability is used to run parallel chaos experiments. "Chaos Step" pulls a chaos experiment from the user's project into the pipeline stage, as shown below.

The pipelines can be run manually or through an API.
Observing the resilience test results
From the execution view, you can get the resilience score and the percentage of successful resilience probes when chaos is injected under load. A sample execution view is shown below.
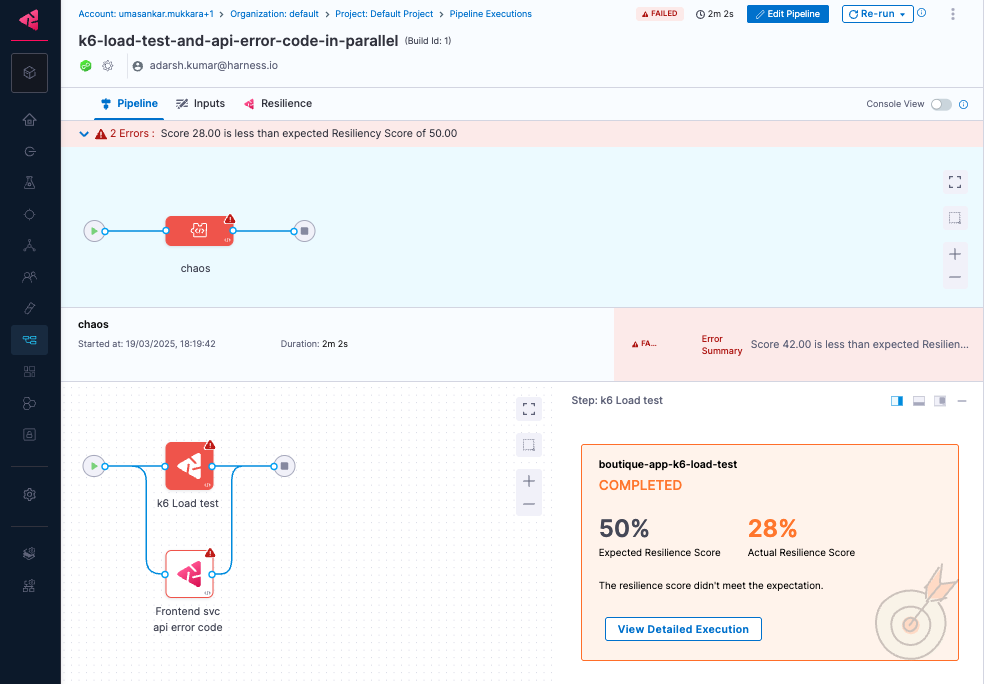
The summary of resilience probes is shown in the Resilience tab of the pipeline execution view.

In summary, chaos experiments and Grafana K6 load tests are created using the out-of-the-box faults and can be run parallel using the pipelines.
Run Your First Chaos + Load Test Now
Ready to see how your systems behave when it matters most?
Sign up for Harness Chaos Engineering and start combining real-world failure scenarios with load testing using Grafana K6. Whether you're preparing for your next peak traffic event or hardening your microservices for long-term resilience, this integrated approach helps you move from theory to reality—fast.
🔧 Get Started Free with Harness Chaos Engineering
📚 Need help setting up? Check out the Docs
🚀 Already onboard? Try injecting your first chaos experiment with load today and discover your resilience score.
.jpeg)
All this author’s posts
Matt Schillerstrom is a Product Marketing Manager at Harness, specializing in Feature Management, Chaos Engineering, Database DevOps, and AI-native DevOps.

All this author’s posts
Uma Mukkara is Head of Chaos Engineering at Harness, where he helps teams improve reliability by safely testing how systems behave during real-world failures. Earlier, Mukkara co-founded MayaData and helped build cloud-native technologies such as OpenEBS.