.svg)


AI-assisted
Deployment Verification
Deploy with confidence as Harness uses AI to automatically detect variance in metrics and logs after a deployment. You can automatically rollback if a regression is found.


The Old Way Was Broken
Manual Dashboard Watching
Slow, error-prone, and unscalable. By the time a human spots a trend, your customers already have.
Reactive Alerting
Waiting for alarms means you're already too late. This isn't prevention; it's damage control.
The Configuration Bottleneck
The biggest problem: Getting verification set up requires a meeting between Dev, DevOps, and SRE. It's so painful that it rarely gets done.
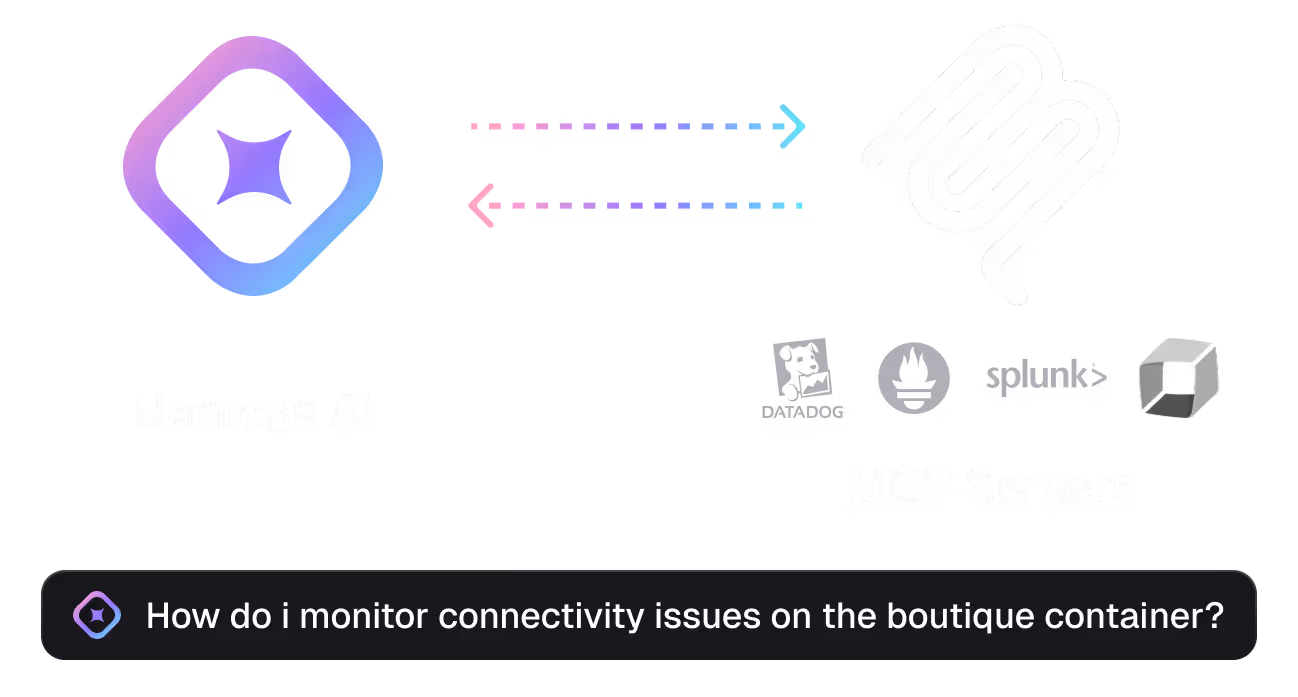
Your SRE, Codified.
Harness AI now acts as your expert SRE, securely connecting to your observability tools (Datadog, Prometheus, Splunk, etc.). It intelligently analyzes your service and automatically generates the health verification profile. It knows which metrics to watch and which log patterns to look for, so your teams don't have to. The result is an enterprise-grade safety net, configured in minutes, with zero meetings required.
Verify your Deployments
with your Metrics
Taking the toil out of manually correlating deployment metrics, Harness has the ability to verify your deployments from a wide variety of metric providers such as AppDynamics, Datadog, Prometheus, and Cloudwatch. Harness can analyze the incoming metrics and compare those metrics against a stable baseline and determine if you are trending towards regression.
Learn more about metric verification results ->
Verify your Deployments with Logs
Harness has the ability to verify your deployments from a wide variety of log providers such as Splunk, Elasticsearch, Grafana Loki, and Google Cloud Ops. Harness can analyze log events for their presence and increase in frequency against a stable baseline using unsupervised machine learning.
Learn more about log verification results ->
Take automatic or manual action
As part of your Harness Pipeline, Deployment Verification can follow any failure strategy that a Harness Pipeline supports. You can automatically rollback a deployment if a regression is found or bring in human intervention with smart notifications.
Learn more about take automatic or manual action ->
Leverage continuous verification today
Monitor Deployment Health
Monitor the health of a deployment by validating metrics and logs from one or many sources
Rollback Automation
Automated rollback of problem releases tied to deployment strategy
Smart Notification
Optionally bring in human intervention with smart notifications
