
Integrating Fluentd with Harness ECS Delegate enhances log management by providing a consistent logging format and leveraging AWS Firelens for efficient log routing and aggregation, improving system health and performance monitoring.
One of the first items you learn as a professional engineer is about the presence [and over presence] of logs. On your personal laptop, you might have come across logs in a crash report your operating system vendor collects. Though as engineers as we enter the professional world, the console output of our university projects need to be captured somewhere; enter logs.
Logs are certainly big business and there is a bloom of logging frameworks out there. In the days gone by logs have not been the most fun non-functional requirement to work on. As our systems become more distributed, understanding the health and performance of our systems require systems themselves. Logs can be seen as a foundation into the insight of events in our systems.
What is a log?
Not to be confused with the wood variety or a logarithmic function, logs(https://en.wikipedia.org/wiki/Log_file) are pieces of event output that our systems produce. Since code is literally a set of instructions, we have the opportunity to log the interactions of all of those instructions.
Certain interactions are more important to capture than others. Verbosity or granularity of your logging statements is an engineering decision point. Typically in lower environments when you are creating something new, you have a more verbose set of logs meaning you capture more to validate and debug. As we move towards production, we tend to have less verbose logs to only capture critical events. If there is a problem, logging verbosity is typically is increased again in an environment for a short period of time e.g production until a resolution.
As systematic records, logs can be processed by humans or more often than not other systems. There are purpose-built tools for log aggregation such as Splunk(https://www.splunk.com) and we can forward our logs to other systems such as an ELK [Elastic, Logstash, Kabana] stack. The simple log file has grown more complex as our systems have grown more complex.
Why are logs hard?
Logs come in all shapes and sizes. Usually up to the engineer to decide what and when log. Most likely as part of a development standard, logging standards and coverage are set. Though when building an application or a piece of infrastructure, the actual implements of the logging is up to the engineer.
We generate so many events, logs can also be seen as a bottleneck. Imaging a high value and low latency messaging system, if you were to log the content of each message, the system needed to maintain the logs at velocity would require as much computing power than the messaging system itself.
Each application, platform, system, etc generate different logs in different places. For example, your application might have application specific events that write to web server logs that interact with a database that also has logs/records which reside on an operating system writing to systemd. Most likely there are more logs than that in your application in your infrastructure stack. You can see how easily the logs can add up.
Log content can also be taxing for the system needing to generate the logs. For example, if you include a full stack trace [the linage of the calls being made], it requires more overhead than a simple message. Over one of two events, not a big deal but for multiple users in the system that is distributed, the overhead will certainly add up.
With so much firepower needed to capture every event properly, the math starts to creep in with statistical significance(https://en.wikipedia.org/wiki/Statistical_significance). Modern applications and platforms are designed to be elastic and scale up and down depending on the workload. Because of scale, does it make sense to fully monitor every running container? Perhaps we can take a small set which is still statistically significant as a sample e.g one out of every three containers.
Depending on the language there might be other methods to instrument e.g in JAVA you can instrument the byte code thus how Application Performance Management [APM] vendors were born. APM vendors also have sophisticated ways of sampling other than looking at log data. Logs do take time to get written and aggregated which are part of the logging layers.
Logging Layers
Logging methodology and architecture certainly take consideration. Unlike my belief as a young engineer that logs just magically appear, they are part of the system and have design considerations. In this excellent Medium Post, the author goes through logging in a modern application stack and what to do with the logs once you have them.
We can classify logging systems into three layers. Functionally you need to intercept, route/forward, and aggregate your logs.
Interceptor: The job of a logging interceptor is to decide what events or instructions need to be captured and at what verbosity. Should items that are fatal be captured or should items that are more informational be captured. This is usually configured in an interceptor to look out for log statements in the codebase.
Router/Forwarder: Your logs have to go somewhere even if that is a text file on your local system. The job of a logging router is to do just that, to route where the logs get written to and ultimately delivered to. More often than not, logs are headed to another system for processing and retention. Potentially a big data system to look out for anomalies quicker or a database for compliance and retention.
Aggregator: In life, there are a few absolutes with death, taxes, and you will have more than one log. Aggregators are common now as our systems that our users transverse are distributed. The job of a log aggregator is to find relationships between the dozens of potential logs and present them in a concise or conclusion based way.
We can take a look at how the layers play together with one of the newest logging packages out there, Fluentd.
Wire the Harness Delegate with Fluentd
A goal for many is to have a consistent logging format and logging provider. A CNCF project that reached graduation maturity last year is Fluentd. A goal of Fluentd is just that to be a common logging provider. As a project, Fluentd and sub-projects such as Fluent Bit (https://fluentbit.io) hope to achieve logging excellence.
To take a look at the power of modern logging, as an example can wire a Harness ECS Delegate to leverage AWS Firelens for log output. By following the steps from AWS, we can get up and started pretty quickly. Be sure to note down The ECR information for your availability zone for the log router image.
This example does require a little familiarity with Amazon ECS. The Harness Documentation is a great place to learn about getting an ECS Delegate deployed. In the Harness Community, we also have an excellent post if you have not used any ECS services before. This same example also works for your own Amazon ECS deployments, not only the Harness ECS Delegate.
Depending on what flavor of AWS ECS you leverage, the placement of the Container Definition for the Fluent Bit(https://fluentbit.io/) log router might vary. In my downloaded Harness ecs-task-spec.json placed the Fluent Bit configuration ahead of the Harness ECS configuration.

{
"essential": true,
"image": "906394416424.dkr.ecr.us-east-1.amazonaws.com/aws-for-fluent-bit:latest",
"name": "log_router",
"firelensConfiguration": {
"type": "fluentbit"
},
"logConfiguration": {
"logDriver": "awslogs",
"options": {
"awslogs-group": "firelens-container",
"awslogs-region": "us-east-1",
"awslogs-create-group": "true",
"awslogs-stream-prefix": "ecs"
}
},
"memoryReservation": 50
},
Next, make sure the IAM Role that is executing the ECS Task has permissions for Firelens and CloudWatch.
In the AWS Example, the ECS Task will need to create CloudWatch Logs and Log Groups so the Execution ARN Role needs to have permissions for Firelens/Firehose and CloudWatch which can be modified with an IAM Role.

With the modified ecs-task-spec.json, you can register the task definition and let ECS launch the service. The downloaded Harness ECS Delegate has the task definition and service spec.
aws ecs register-task-definition --cli-input-json file://ecs-task-spec.json
aws ecs create-service --cli-input-json file://service-spec-for-awsvpc-mode.json

Once the ECS Task is up, head over to the AWS CloudWatch UI and see glorious log data starting to appear.

You Can validate that your Harness ECS Delegate has registered by going to the Harness UI and Setup -> Harness Delegates.

You are now on your way to log nirvana.
Harness Here to Partner
The Harness Platform has the ability to help make judgment calls on your deployments based on your logs as one source of input. With our Continous Verification capabilities, digging into insights provided by Splunk or your ELK stack can drive confidence.
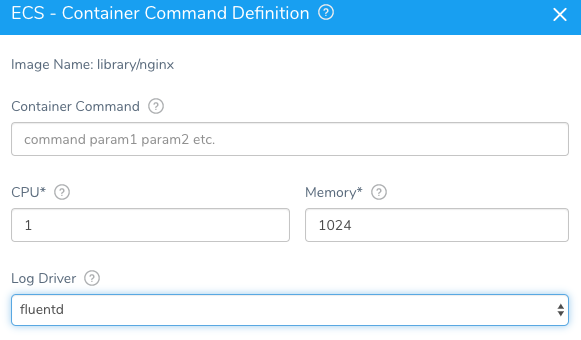
With an Amazon ECS deployment with Harness, we make picking your choice and configuration of a Log Driver simple for Fluentd and beyond.
If you are curious how to start turning your logs into actionable items, adding Harness to the mix will help orchestrate the needed steps. Feel free to sign up today.
Cheers!
-Ravi

All this author’s posts
Ravi Lachhman builds the systems that help platforms scale. Over the past 15+ years, Ravi has worked across distributed systems, open source, DevOps, and enterprise modernization. Today his focus sits at the intersection of product, ecosystem, and revenue, turning complex platforms into durable adoption engines. Ravi has led developer advocacy, product initiatives, partner programs, and certification strategies in high-growth environments. He cares deeply about technical credibility and alignment across product, sales, and services so adoption is not accidental, but intentional and measurable. At his core, Ravi is a systems thinker who enjoys operating where product, field, and community intersect.