
One of the most popular lean exercises for software development, value stream mapping gives leadership teams the ability to optimize their software delivery process. This lean technique is used to capture current state, and it maps team responsibilities to the processes within the value stream of a software service. Lean techniques and processes help teams understand, prioritize, and adjust to their ways of working in order to accelerate their software delivery.
What is Value Stream Mapping?
Value stream mapping (VSM) is a lean manufacturing technique popularized in the 90s after its successful applications in the manufacturing industry with companies like Toyota. Since then, DevOps practitioners have shared these processes, as they apply to software development. DevOps literature, such as The DevOps Handbook, suggests value stream maps inform the most critical areas and needs for DevOps practices and technology.
A VSM is also known as a material and information flow map. Using this map, you can identify bottlenecks in your value stream and target areas of improvement to map your current state of delivery to your future state of delivery. Creating a map with the right stakeholders of your software service ensures everyone involved in the process understands their work and how it impacts their software service.
Symbols and Components
In a VSM, we look at value as it relates to the flow of information, the flow of materials, and the flow of time. These three types of flow are required for all organizations and businesses to deliver a product/service to a consumer. A VSM is broken up into three horizontal sections. Let’s discuss these components alongside the common symbols used when creating a value stream map.
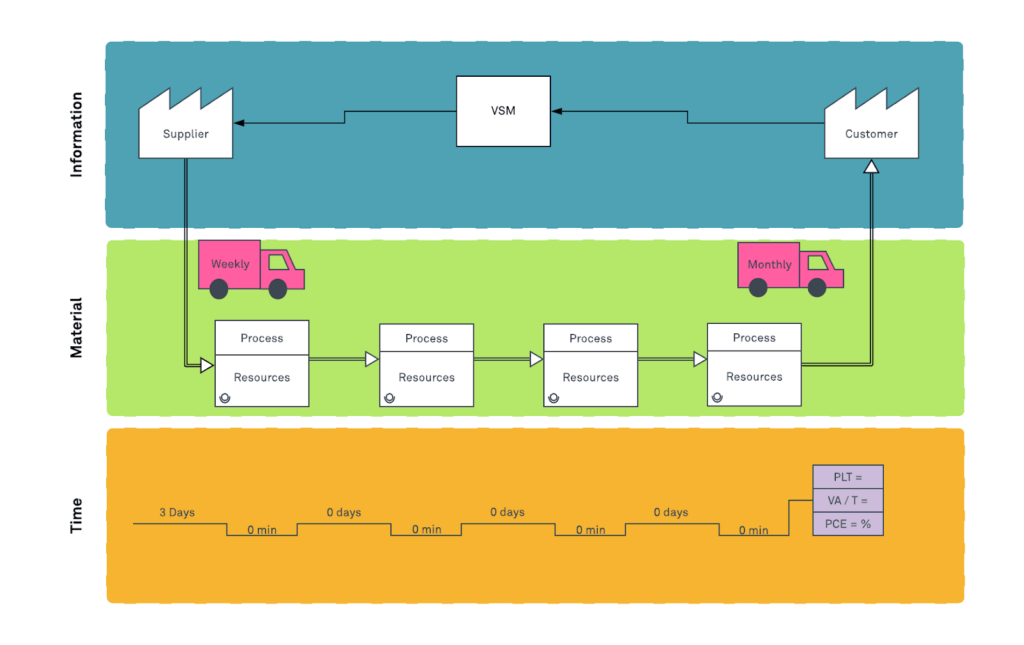
Information Flow and Symbols
In the topmost section belongs the supplier and consumer of the value delivered. The supplier symbol represents the organization or the host of the software application. The consumer (on the right) shares information, which gets processed by the supplier and fed into the process for creating new value that goes back to the consumer.
Note that the flow of information goes from right to left in a VSM. And, in contrast, the flow of material and time goes from left to right in a VSM.
Material Flow and Symbols
In the second section of a VSM, we create boxes to capture the process for producing a material or change. The arrows between boxes denote nonlinear/sequential relationships between processes. Ideally, each process box produces some artifact or change in the supply chain. Most material production processes are sequential, but if your process is complex or granular in VSM, you’ll want to capture the most important or most common processes used.
Also note there should be an arrow between the supplier symbol in the information flow section that points to the first process box in the material flow section. This signifies the relationship between the material flow and the information provided consumer.
The final process box in the flow of material should be the last step before a material is shipped or made available to a consumer. Make note that there should be an arrow connecting the last process box to the consumer symbol found in the information flow section.
Finally, the truck symbol represents the cycle time, which can correspond to a frequency of weekly, monthly, etc. Requirements or information can come in the form of backlog grooming dictated by sprints, and likewise, production deployments can occur manually on a regular basis - or even on-demand.
Each process box should track the resources and raw materials associated with the processes. If it’s useful, track details like the team members involved, and the key items produced within each process. A triangle symbol represents inventory produced within each process box.
Time Flow and Symbols
Lastly, a VSM has a flow of time to showcase lead time in the flow of materials and information. Note that time is measured only for every process in the flow of materials section, but also between every process. If you add up every item in the flow of time, this is the current lead time to value.
These are several components of a VSM, and this post shared the major symbols. There may be additional VSM components and symbols that are helpful for more complex value stream exercises. This resource explains those VSM components in more detail.
Creating a Value Stream Map

Here are the steps to a value stream mapping exercise:
- Select the product or service you’d like to draw a value stream map for. Start with the most important / highest value proposition. In this example, I have Simple Service at the top center of my VSM.
- Start with your customers. The customer should drive the entire stream of value. In this example, a customer sends all their requests to a simple service.
- Define your start and end processes. Scope your VSM with a start and end trigger. Here, I have prioritized reported bugs as my starting event. Likewise, deploying the feature is my final event.
- Include information flow. Reach that information flows from right to left in a VSM. In my example, I have “Feature Requests” as the trigger to my start process. Once code has made it to production, I have “Ship the Service” as my final flow of information.
- Fill in the remaining processes. In my example, I have the components of a standard software lifecycle: develop, build, test, and deploy. I could also add in counts of inventory or average quantity between processes.
- Gather process data. I am including who is involved in each process along with the tools they use. Be objective in this step and the following one. The goal is to capture the current state.
- Create the timeline. Here, I map current metrics on each process. There are three standard metrics used in VSM: Lead Time, Process Time, and Percent Complete&Accurate. Lead Time is the elapsed time or time from initiating the phase to completing it. Process Time is the amount of time it takes to handle said request. Percent Compete&Accurate (%C&A or PCA) is the percentage occurrence where the finished output was correct, according to the requirements of the customer of the process.
Value Stream Analysis
Now that we have a VSM, let’s discuss how to analyze it and make decisions informed by the resulting map.
Optimizing a Value Stream
Identifying areas of improvement is one technique for optimizing the flow of value within your organization. A practice that borrows from lean manufacturing and the Toyota Production System is the concept of muri (overburdening), mura (unevenness), and muda (waste).
Muri
Muri is a Japanese word meaning unreasonable. Often, one person will be working manually to oversee many responsibilities or activities. Muri refers to situations that are beyond one person’s ability.
Some ways to alleviate muri in a software development life cycle is to further discuss the work and logical directions needed to complete each task associated with that function. Any repeatable processes within the process should be automated. Finally, consider takt time and if expectations around a particular task make sense. This is meant to set better expectations. For example, an application takes 10 minutes in the testing process because of timed loading testing. We can’t reasonably expect this process to complete in less than 10 minutes if there’s a requirement to run a load test of 10 minutes on the application.
Mura
Mura is the japanese word for “lack of uniformity.” If you have mura in any of your processes, it is useful to introduce pull systems. In a pull-based model, processes inventory is kept to minimum as processes take action based on produced items by the preceding process. Continuous deployment is an example of a pull-based system: as soon as a change is integrated into a new artifact, a CI/CD pipeline deploys that change and makes it available to a customer. Another pull system is an agile practice known as kanban (read our Agile Foundations blog post for more information).
Muda
Muda is the Japanese word for “useless.” If you are not adding value, you are adding cost and waste. There are eight types of waste defined through the lean manufacturing movement. These also apply to software delivery.

How Value Stream Mapping is Used in Software Development
Analyzing software value streams is about encouraging continuous flow through our processes. Look at each process outlined in your VSM and discuss the following characteristics: valuable (does the customer need this?), capable (quality results), available (minimal downtimes), adequate (meets demands), flexible (can be switched or configured).
Then, focus on flow: is flow continuous or stagnate? Consider your quantity levels. In the earlier VSM example, the flow could stagnate if there are no feature requests. Likewise, if you have too many features developed, your QA process may need more scaling. Identify areas where your value stream is suffering, if stagnation exists.
Finally, analyze the flow of information within your organization. Is it generally a push or pull model? In push models, the supplier supplies customers with features and deliverables. In a pull model, the customer is requesting those features. It’s important to have the right balance to ensure you're not overtaxing specific job functions and processes in your value stream.
Common Challenges
There are a few challenges that can occur with Value Stream Mapping.
Future State Versus Current State
Depending on the software service, outlining the process step may be a challenge. This is especially true if there is a lack of standardization or understanding between participants regarding the production process. The current state map should only include what the process is like today. Future state maps are great to create with the team when designing an implementation plan.
Ensuring the Right People Are in the Room
The success of a value stream mapping exercise hinges on the people involved in the process. A facilitator encourages and manages the entire VSM exercise, ensuring that there is collaboration and communication between participants, but that the conversations don’t steer too far away from the goal or topics at hand. Facilitators don’t have to be an employee or a key member of the software team, but they should encourage stakeholders to be involved in the process so that team leads can start leveraging lean thinking best practices and continuous improvement.
Key Takeaways
A well-executed VSM workshop gives those in the room the opportunity to champion change. Maybe you’re using an outdated tool for a certain process. In that case, a VSM workshop could invite critical stakeholders to identify and take action on challenging areas of your value stream.
Accelerate Your Software Delivery Processes With Harness
Every organization has a process for delivering their product or service to their customers. Value stream mapping allows you to optimize your flow of materials and information by lowering costs and improving value-adds. If software deployments are slowing down your value stream efficiency, try the Harness the CI/CD platform. Build, test, deploy, and verify your software deployments with Harness’ software delivery platform.
All this author’s posts
Harness is a unified, end-to-end AI software delivery platform to manage the SDLC using purpose-built AI agents